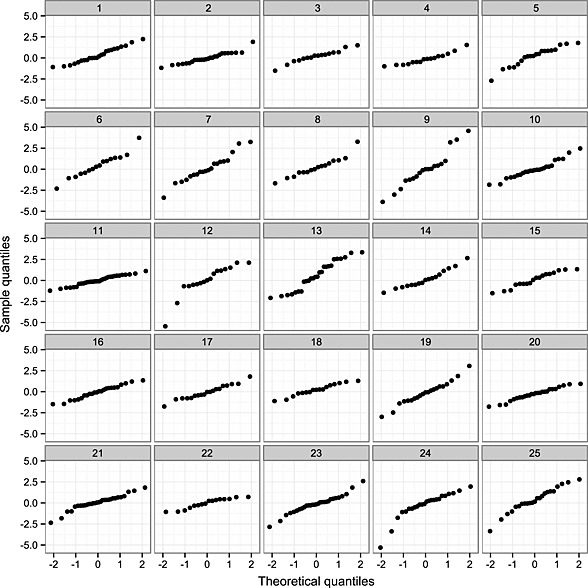
Figure 4.

Quantile–quantile plots for the residuals under the ‘random slopes + fractional Brownian motion + measurement error’ multivariate‐t model of 25 randomly selected individuals with greater than 15 observations. The residuals for individual patients have been transformed by the inverse of the Cholesky decomposition of their estimated scale matrix ( ) without any correction for the unobserved scale variable τ i. Theoretical quantiles in each case are those from the standard normal distribution.
