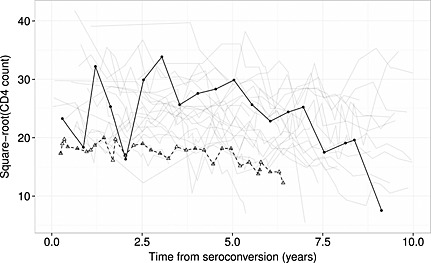
Figure 5.

Line plot of the square‐root transformed CD4 counts observed in the random sample of 25 patients with greater than 15 observations (as in Figure 4). The observations for the patients corresponding to Plot 9 (solid black line, filled circles for individual data points) and Plot 11 (dashed black line, open triangles for individual data points) in Figure 4 are made prominent.
