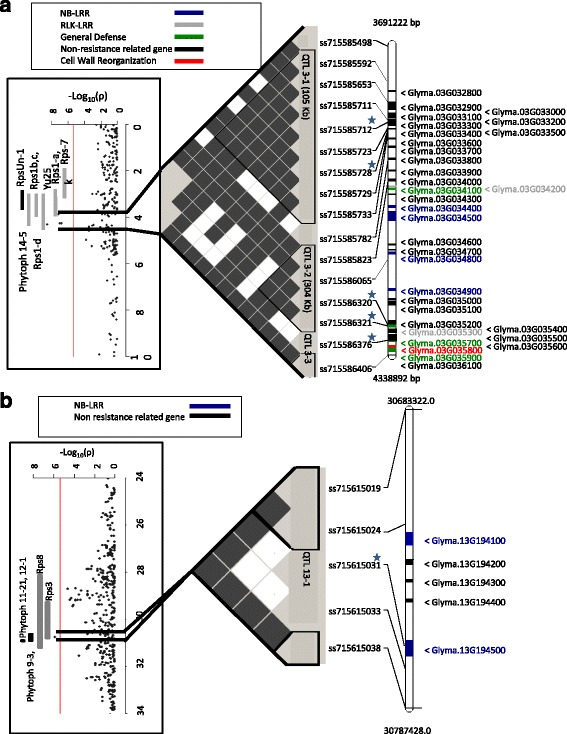
Fig. 3.

QTLs identified for root rot score on chromosome 3 (a) and for inoculated root weight on chromosome 13 (b). The far left image is a Manhattan plot indicating the level of marker association with either root rot score or inoculated root weight. The central image contains a visualization of linkage disequilibrium (white is an r2 value of zero, black is an r2 value of 1). Significant haplotype blocks are outlined in black. The far right image is a physical map of markers (stars indicate markers significantly associated with inoculated root rot score) and candidate genes with text color indicate the general annotation categories related to resistance
