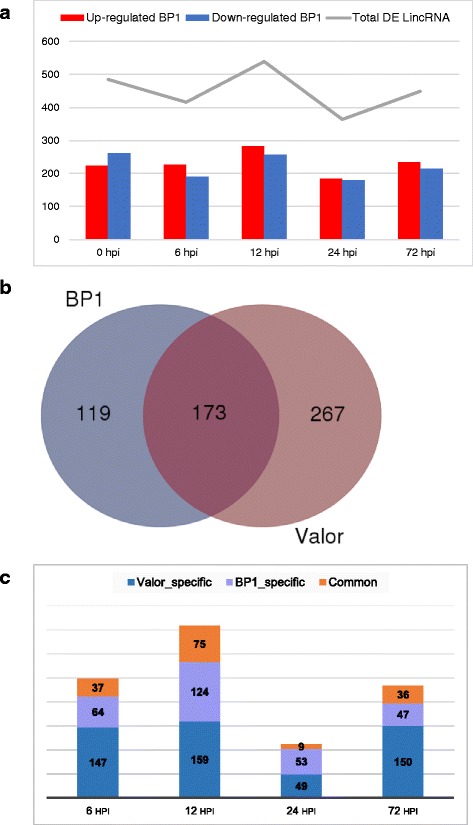
Fig. 4.

LincRNAs significantly expressed over time between Valor and BP1 following infection with Pcb1692. a Pairwise comparisons between S. tuberosum cv Valor and S. tuberosum cv BP1 at each time-point. Red represent significantly upregulated and blue represent significantly downregulated. b Comparison of DE lincRNAs specific to each cultivar in relation to the mock-inoculated samples (0 hpi). c Numbers of DE lincRNAs common or specific to each cultivar at individual time-points in relation to mock inoculated samples
