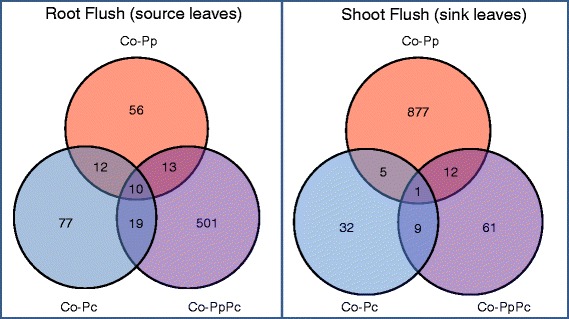
Fig. 1.

Venn diagram illustrating the numbers of significant differentially expressed contigs (DECs). Overlapping areas represent DECs common to different inoculation treatments. The figure compares the following pairs of oak microcuttings during root flush and shoot flush: Control versus Pratylenchus penetrans (Co-Pp), Control versus Piloderma croceum (Co-Pc) and Control versus sequential-inoculation of P. penetrans and P. croceum (Co-PpPc). FDR cut-off = 0.01
