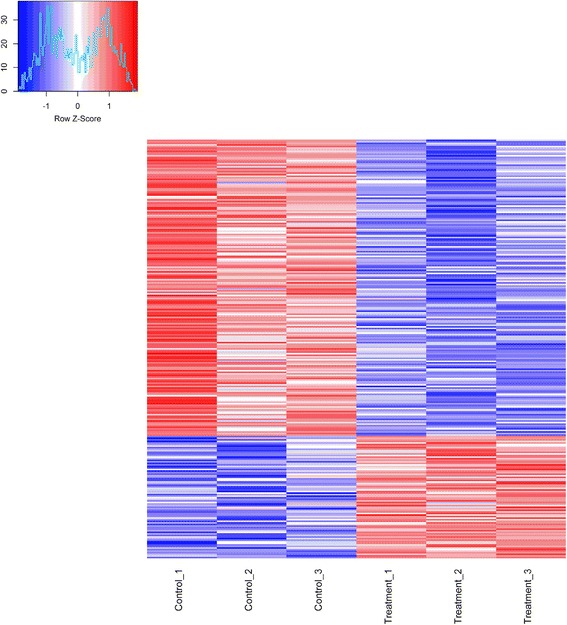
Fig. 3.

The relative expression level (in FPKM) of differentially expressed genes between control and treatment groups. The X-axis is sample expression pattern in different concentrations of ammonia exposed groups. The first three samples are in control group; the latter three samples are in treatment group. The Y-axis is the gene clusters across groups
