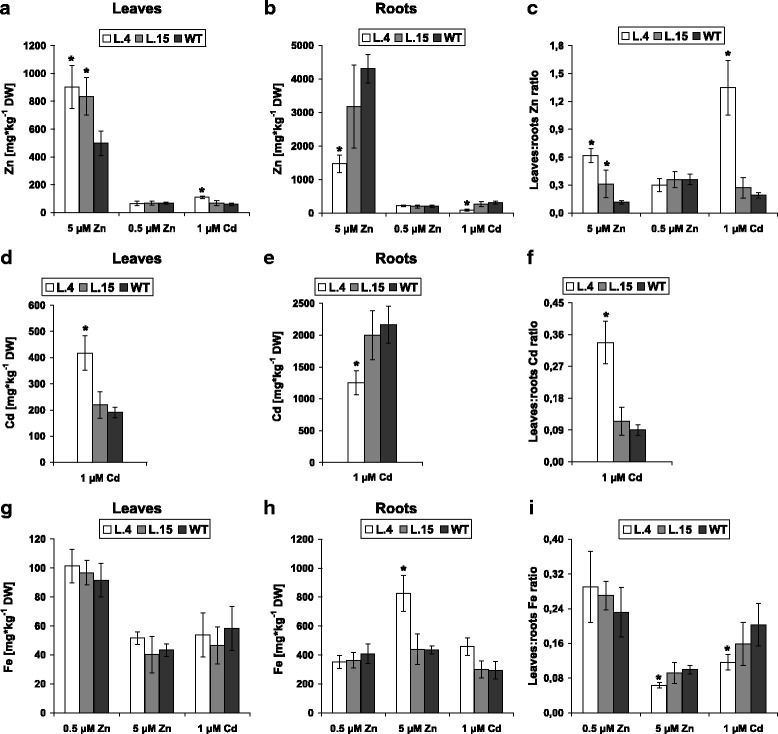
Fig. 1.

Zn, Cd and Fe concentration in 24-day-old transgenic (lines 4 and 15) and wild-type plants. Plants were exposed to 5 and 0.5 μM Zn (control) for 2 weeks and to 1 μM Cd for 11 days. Zn concentration in leaves (a); roots (b); leaves/roots Zn concentration ratio (c). Cd concentration in leaves (d); roots (e); leaves/roots Zn concentration ratio (f) of Cd-exposed plants. Fe concentration in leaves (g); roots (h); leaves/roots Fe concentration ratio (i). Values correspond to means ± SD (n = 6); those significantly different from the WT (Student’s t-test) are indicated by an asterisk (P ≤ 0.05)
