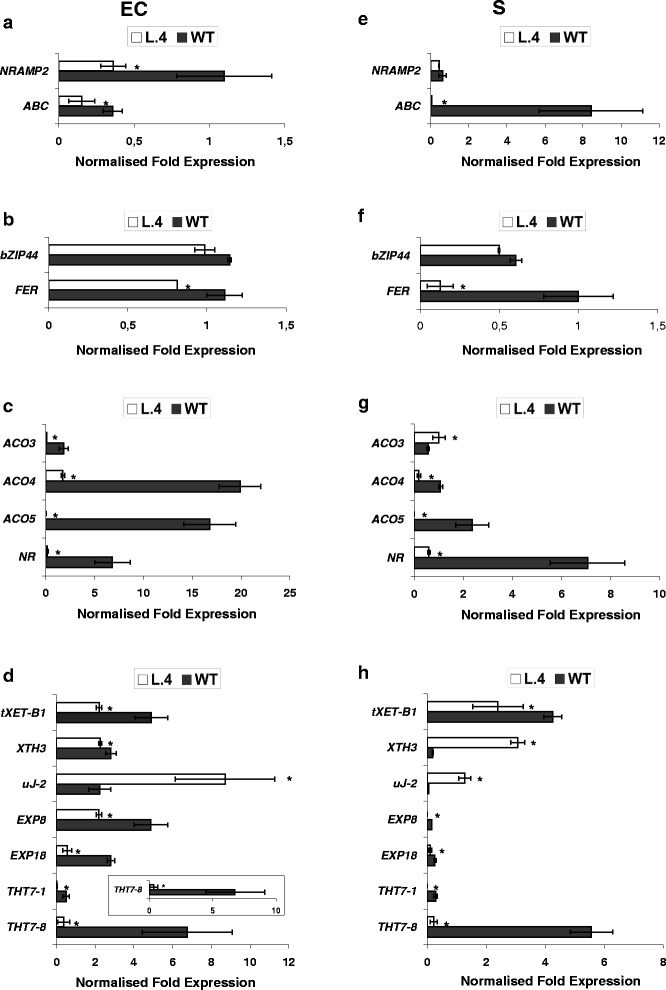
Fig. 3.

Confirmation of microarray results by quantitative real-time PCR. The chosen genes identified by microarray analysis as differentially expressed in the epidermis + cortex (EC) and stele (S) from roots of 17-day-old AtHMA4-expressing plants (lines 4) and in the wild-type (WT) grown in the presence of 5 μM Zn for one week. Normalized fold gene expression for (a) metal transporters and uptake facilitators; (b) transcription factors; (c) cell wall modification; (d) ethylene pathway genes. Values correspond to means ± SD (n = 3); those significantly different from the WT (Student’s t-test) are indicated by an asterisk (P ≤ 0.05)
