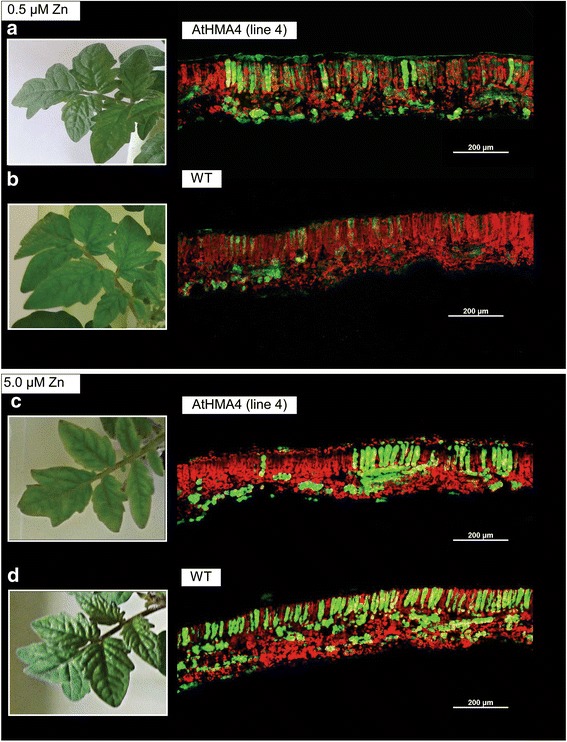
Fig. 9.

Zn distribution at cross sections through leaves visualized by Zinpyr-1. Cross sections made through leaves of 17-day-old wild-type (a, c) and AtHMA4-expressing tomato plants from line 4 (b, d) grown for one week in the presence of 0.5 μM Zn – control conditions (a, b), and 5 μM Zn (c, d). Confocal laser scanning microscope (CLSM) settings were different for sections made from leaves grown under control conditions and followed by 5 μM Zn due to the stronger fluorescence of leaves exposed to high Zn. Magnification bars are indicated in the figure
