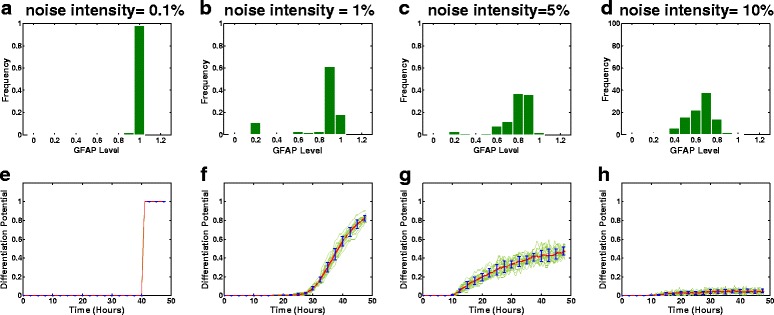
Fig. 4.

Stochastic cellular responses of glioma cells to differentiation therapy simulated using the ANM model with different noise intensities. The noise intensity was set at 0.1, 1, 5 or 10 %. The upper panel a, b, c, d shows the probabilistic distribution of GFAP at 48 h during drug treatment (CT = 10 ng/ml) at different noise intensities. The lower panel e, f, g, h shows the stochastic temporal evolution of the differentiation potential of the glioma cell population at different noise intensities
