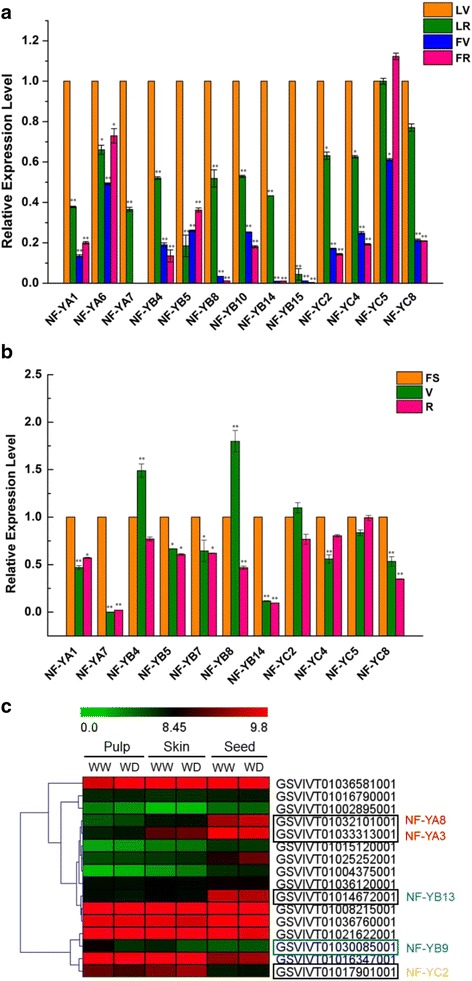
Fig. 6.

Expression profiles of VvNF-Ys in grape leaves and berries at different developmental stages. a Detailed expression levels of VvNF-Ys in grape leaves and berries. LV and LR denote leaves at veraison (V) and fully ripe (R) while FV and FR represent berries at V and R, respectively. b Detailed expression levels of VvNF-Ys in grape berries at three different developmental stages: fruit set (FS), V and R. c Expression patterns of VvNF-Ys in different berry tissues. WW and WD mean well-watered and water-deficit conditions, respectively. Grape Actin1and UBC were used as internal controls of quantitative real-time PCR analysis. The data are presented as mean values ± SD. * and ** represent statistically significant (P < 0.05) and highly significant (P < 0.01) differences, respectively. Significance of values in (a) was based on comparison of expression levels in leaves and berries at different stages with expression levels in leaves at V while in (b) was based on comparison of expression levels in berries at V and R with expression levels in berries at FS
