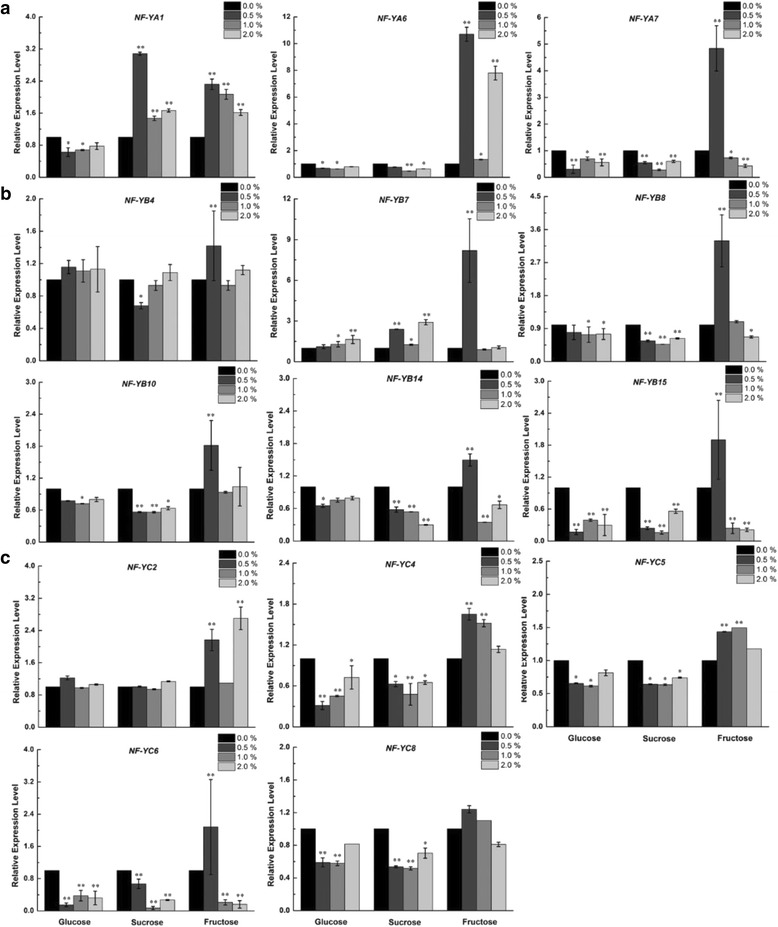
Fig. 8.

Detailed expression levels of VvNF-Ys in response to exogenous sugar treatments. VvNF-YAs (a) VvNF-YBs (b) and VvNF-YCs (c) are divided into three groups. Relative expression levels were measured by quantitative real-time PCR, and grape Actin1 and UBC were used as internal controls. The data were showed as mean values ± SD. * and ** represent significant (P < 0.05) and highly significant (P < 0.01) differences, respectively. Significance of values was based on comparison of expression levels at 0.5, 1.0, or 2.0 % (v/v) sugar with expression levels at 0.0 % (v/v) sugar in ‘Chardonnay’ suspension cells. The experiment was repeated three times
