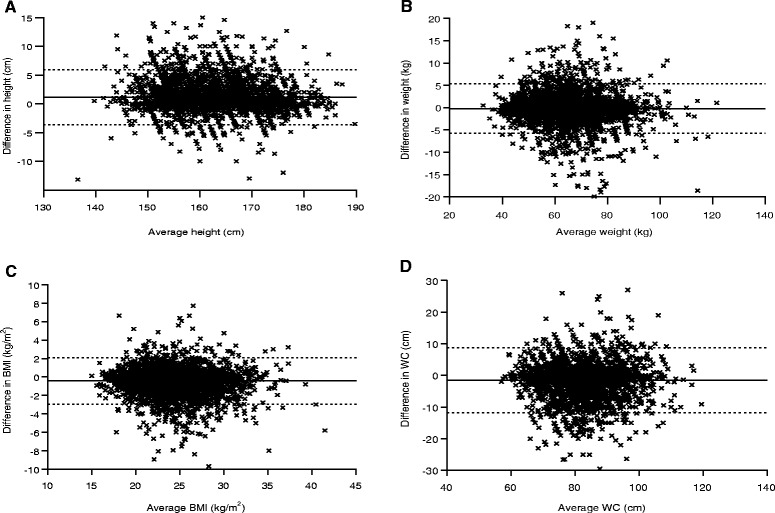
Fig. 2.

Bland-Altman plots of the difference (self-reported minus measured) against the average ((self-reported + measured)/2) of height (a), weight (b), BMI (c) and WC (d). Solid line represents the mean difference and dotted line represents the 95 % limits of agreement. BMI: body mass index; WC: waist circumference
