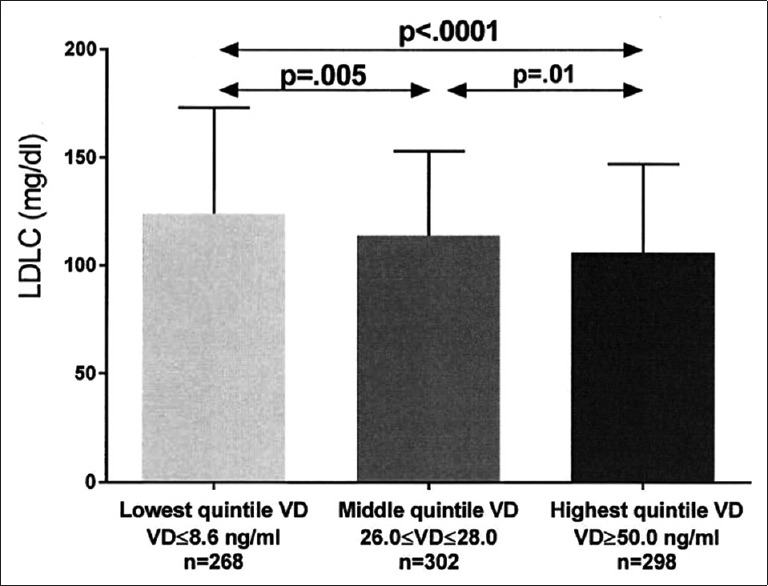
Figure 4.

Unadjusted low density lipoprotein cholesterol (mean ± SD) in the lowest, middle, and highest vitamin D quintiles exhibited. Significant differences between groups are shown, with P values taken from comparisons of least squares means after adjustment for age, race, gender, and body mass index
