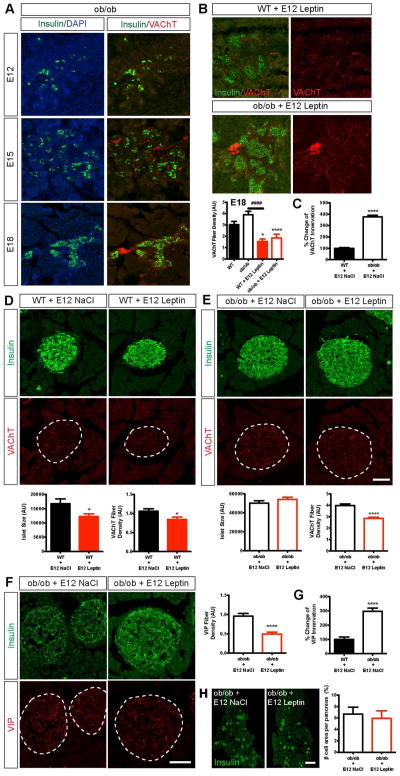
Figure 2. Prenatal leptin exposure impairs parasympathetic innervation of pancreatic islets.
(A) Confocal images of VAChT-positive fibers (red fluorescence) in clode proximity to insulin-positive cells (green fluorescence) in E12, E15 and E18 ob/ob embryos. (B) Confocal images and quantification of the density of VAChT fibers (red fluorescence) innervating pancreatic β cells (insulin, green fluorescence) in E18 WT and ob/ob embryos that were injected with vehicle or leptin at E12 (1 ug per embryo) (n = 4 per group). (C) Percentage change in the innervation of pancreatic islets by VAChT fibers between adult WT and ob/ob mice. (D–E) Confocal images and quantification of pancreatic islet size (insulin, green fluorescence) and of the density of VAChT fibers (red fluorescence) innervating islets in 16-week-old (D) WT and (E) ob/ob mice that were injected with leptin or vehicle at E12 (n = 3–6 per group). (F) Confocal images and quantification of the density of VIP-positive fibers (red fluorescence) innervating pancreatic β cells (insulin, green fluorescence) in 16-week-old WT and ob/ob mice that were injected with vehicle or leptin at E12 (1 ug per embryo) (n = 4 per group). (G) Percentage change in the innervation of pancreatic islets by VIP fibers between adult WT and ob/ob mice. (H) Photomicrographs and quantification of the β cell area in pancreases of 16-week-old ob/ob mice that were prenatally injected with leptin or vehicle (n = 4 per group). Scale bars, 100 um (A–F); and 1 mm (G). *P < 0.05 versus WT (B), and versus WT + NaCl at E12 (D); ****P < 0.0001 versus ob/ob (B), versus WT + NaCl at E12 (C) and versus ob/ob + NaCl at E12 (E, F); ####P < 0.0001 between the indicated groups (B). Values are shown as the mean ± SEM.

