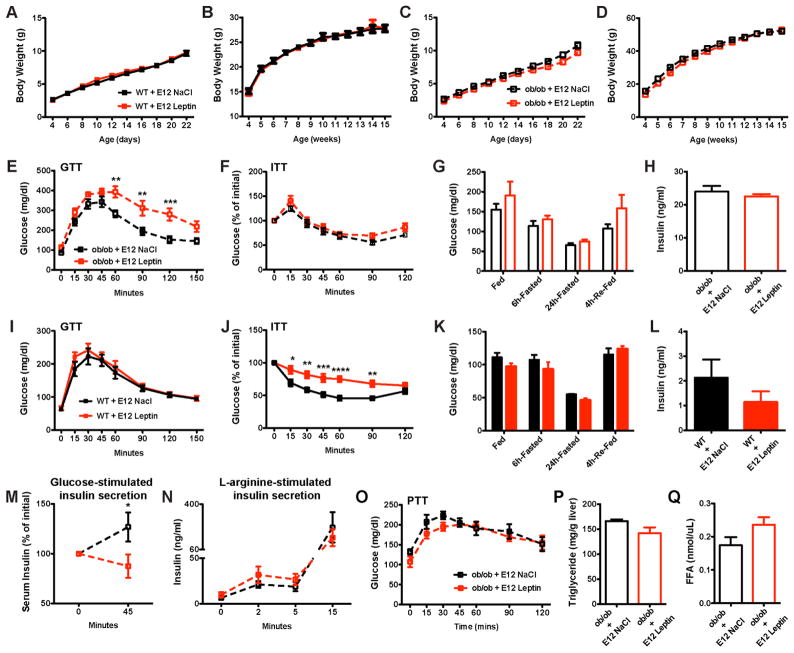
Figure 3. Prenatal leptin exposure causes lifelong dysregulation of glucose homeostasis.
(A, C) Pre- and (B, D) post-weaning growth curves (body weights) of (A, B) WT and (C, D) ob/ob mice that were injected with leptin or vehicle at E12 (n ≥ 10 per group). (E, I) Glucose and (F, J) insulin tolerance tests of 10- to 12-week-old (E, F) ob/ob and (I, J) WT mice that were injected with leptin or vehicle at E12 (n = 5–8 per group for the GTT and n = 7–8 per group for the ITT). Blood glucose levels in 13-week-old (G) ob/ob and (K) WT mice that were prenatally injected with leptin or vehicle (n = 3–7 per group). Plasma insulin levels in 16-week-old (H) ob/ob and (L) WT mice that were injected with leptin or vehicle at E12 (n = 5–7 per group). (M) Glucose- and (N) L-arginine-stimulated insulin secretion in adult ob/ob mice that were injected with leptin or vehicle at E12 (n = 3–5 per group). (O) Pyruvate tolerance test of 8-week-old ob/ob mice that were prenatally injected with leptin or vehicle (n = 6 per group). (P) Plasma triglyceride and (Q) free fatty acids (FFA) levels in 16-week-old ob/ob mice that were injected with leptin or vehicle at E12 (n = 4–7 per group). *P < 0.05 versus ob/ob + NaCl at E12 (M); **P < 0.01 versus ob/ob + NaCl at E12 (E); ***P < 0.001 versus ob/ob + NaCl at E12 (E), and versus WT + NaCl at E12 (J); and ****P < 0.0001 versus WT + NaCl at E12 (J). Values are shown as the mean ± SEM.

