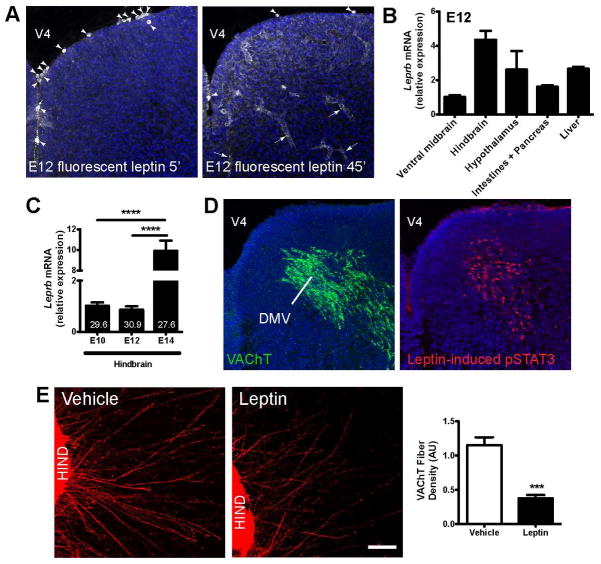
Figure 4. Leptin blocks cholinergic axonal growth from the embryonic hindbrain.
(A) Representative photomicrographs of the hindbrain showing cell bodies (arrowheads) and vessels (arrows) labeled with fluorescent leptin (1ug per embryo, white labeling) 5 and 45 min after it was intracerebroventricularly injected into E12 embryos. (B) Relative expression of Leprb mRNA in various brain areas and peripheral organs of E12 WT mouse embryos (n = 3 per group). (C) Relative expression of Leprb mRNA in the hindbrain of E10, E12 and E14 WT mouse embryos (n = 3–5 per age). Numbers in bar graphs indicate Ct values. (D) Confocal images of VAChT-immunoreactive cells (green fluorescence) and leptin-induced pSTAT3-immunopositive cells (red fluorescence) in the DMV of E12 WT embryos. (E) Confocal images and quantification of the overall density of VAChT-positive fibers in organotypic cultures of isolated E12 hindbrains. The cultures were incubated with leptin (100ng/ml) or vehicle for 48h (n = 5–6 explants per group). DMV, dorsomedial nucleus of the vagus nerve; HIND, hindbrain; V4, fourth ventricle. Scale bar, 100 um. ***P < 0.001 versus vehicle (E); and ****P < 0.0001 between indicated groups (D). Values are shown as mean the ± SEM.

