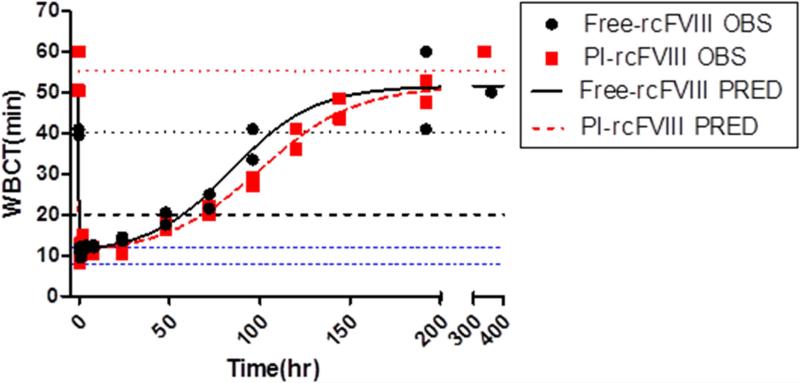
Figure 3. WBCT data and model fit.
WBCT vs time profiles after i.v. bolus doses of 50 U/kg free and PI-rcFVIII in HA dogs. Circles represent individual observed values and the lines represent the model fit. The dashed blue line represents a WBCT of 20 min-the threshold below which spontaneous bleeding is prevented in these dogs. Dotted blue lines represent the WBCT range in dogs with a normal clotting phenotype (8-12 min). Dotted black and red lines represent mean baseline WBCT values prior to free and PI-rcFVIII administration respectively. rcFVIII treatment corrected clotting phenotype to normal levels immediately post dose followed by return to baseline over time which was more gradual after PI-rcFVIII treatment. Return to WBCT values of 20min was prolonged after PI-rcFVIII treatment in one dog.

