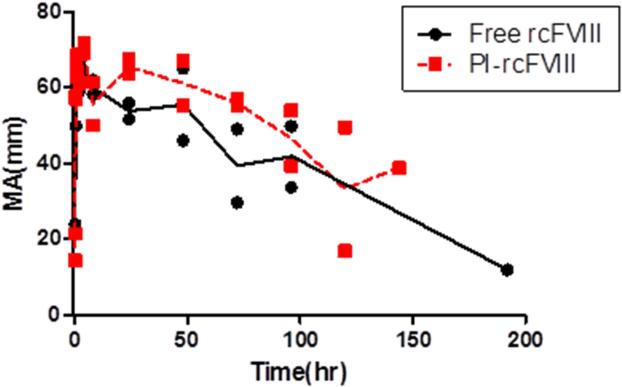
Figure 5. Comparative MA of free and PI-rcFVIII.
TEG (MA) values over time after i.v. bolus doses of 50 U/kg free and PI-rcFVIII in HA dogs. The parameter MA provides an estimate of the strength of the clot formed. Circles represent individual observed values and the lines represent mean MA over time. The strength of the clot formed in whole blood samples was higher after treatment with PI-rcFVIII compared with the free protein.

