
Fig. 3.
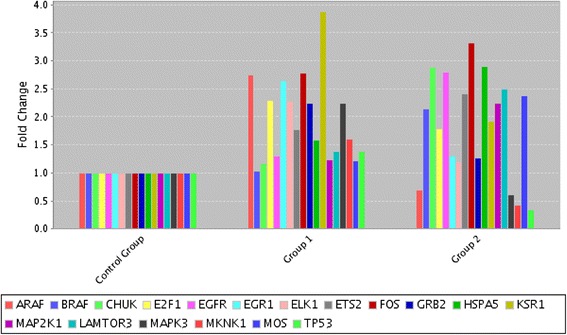
mRNA levels of MAPK and survival pathway members. Two-fold or more differences compared to control cells were evaluated by RT2-PCR array. Group 1: DMSO Control versus Quercetin; Group 2: DMSOcontrol versus Quercetin + Cisplatin
Official websites use .gov
A
.gov website belongs to an official
government organization in the United States.
Secure .gov websites use HTTPS
A lock (
) or https:// means you've safely
connected to the .gov website. Share sensitive
information only on official, secure websites.
mRNA levels of MAPK and survival pathway members. Two-fold or more differences compared to control cells were evaluated by RT2-PCR array. Group 1: DMSO Control versus Quercetin; Group 2: DMSOcontrol versus Quercetin + Cisplatin