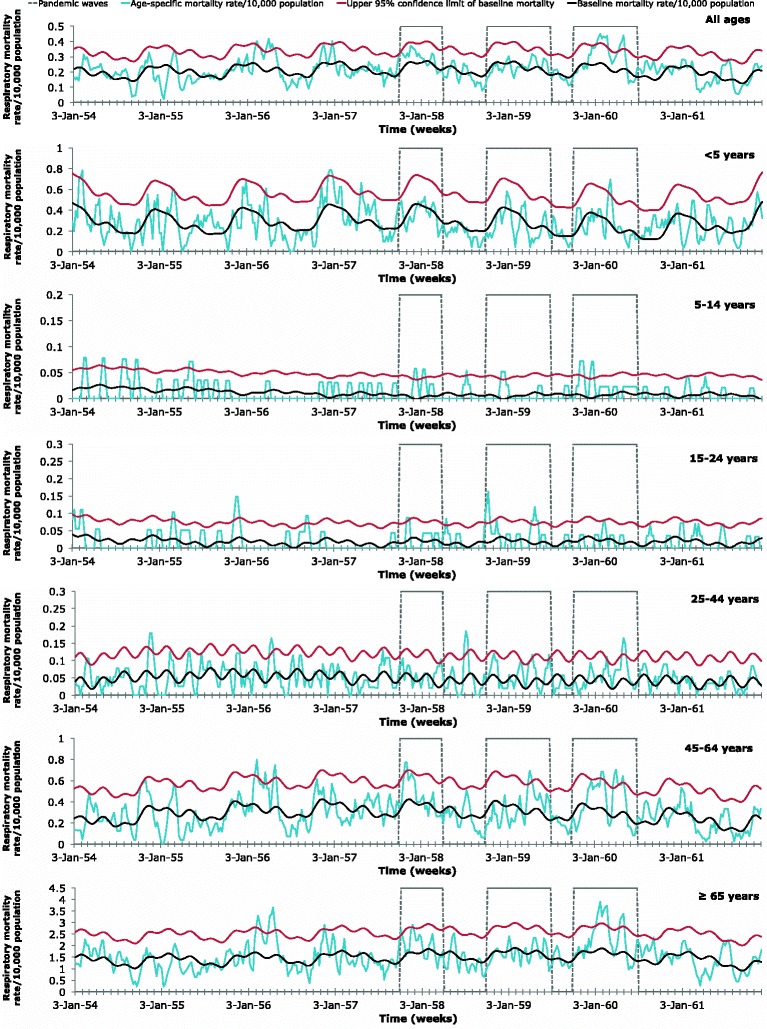
Fig. 2.

Age-specific respiratory mortality weekly time series. 2 Age-specific weekly time series of respiratory mortality per 10,000 population in Maricopa County, Arizona, 1954–1961. Areas outlined in gray represent the three expected pandemic waves: October 1, 1957-March 31, 1958; October 1, 1958-June 30, 1959; and October 1, 1959-June 30, 1960. The baseline mortality (black) was estimated using a cyclical Serfling linear regression model. The baseline mortality’s 95 % upper confidence limit (UCL) is also shown (red). Mortality attributable to the 1957 influenza pandemic was defined as the mortality rates (blue) in excess of the baseline mortality, when the mortality rates exceeded the 95 % UCL of the baseline mortality during the expected pandemic waves
