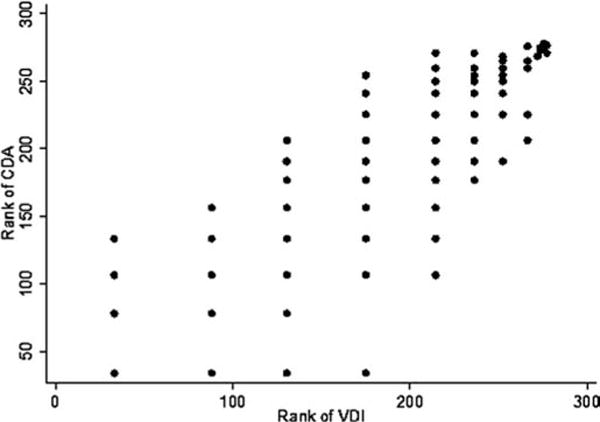
Figure 1.

Scatterplot showing ranked Vasculitis Damage Index (VDI) versus Combined Damage Assessment Index (CDA) scores. Patients with the same score (ties) were assigned the average rank. For example, 66 patients had a CDA score of 0. Therefore, patients 1 to 66 were assigned the rank of (1+66)/2=33.5. The next 23 patients had a CDA score of 1 (in order 67 to 89), so the rank was (67+89)/2=78, and so forth.
