
Figure 2.
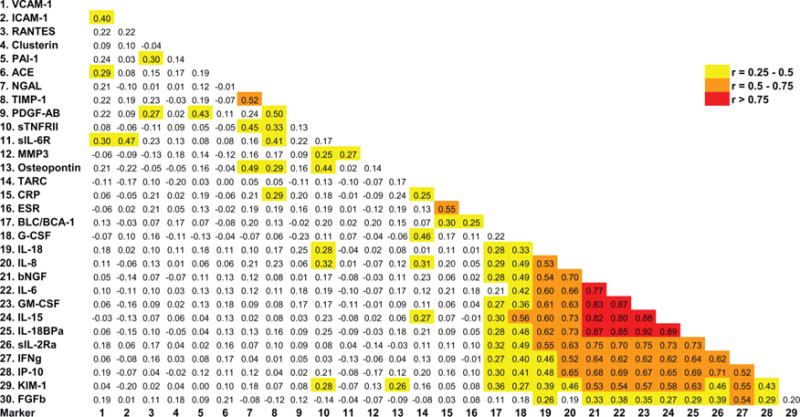
Correlations between marker levels. Spearman correlation coefficients for all pairs of experimental markers as well as erythrocyte sedimentation rate (ESR) and C-reactive protein (CRP) are shown. Background colour indicates strength of association (red, >0.75; orange, 0.5–0.75; yellow, 0.25–0.5; white, <0.25). BCA-1, CXCL13; FGFb, basic fibroblast growth factor; G-CSF, granulocyte colony-stimulating factor; GM-CSF, granulocyte–monocyte colony-stimulating factor; ICAM-1, intercellular adhesion molecule-1; IFN, interferon; IL, interleukin; IL-8, CXCL8; IL-18BP, interleukin 18 binding protein; IP-10, CXCL10; KIM-1, kidney injury molecule-1; MMP-3, matrix metalloproteinase-3; NGAL, neutrophil gelatinase-associated lipocalin; NGFβ, nerve growth factor β; PAI-1, plasminogen activator inhibitor-1; PDGF-AB, platelet-derived growth factor, A and B subunits; RANTES, CCL5; sIL-2R, soluble IL 2 receptor; sIL-6R, soluble IL 6 receptor; sTNF-RII, soluble TNF receptor II; TARC, CCL17; TIMP-1, tissue inhibitor of metalloproteinases-1; VCAM-1, vascular cell adhesion molecule-1.