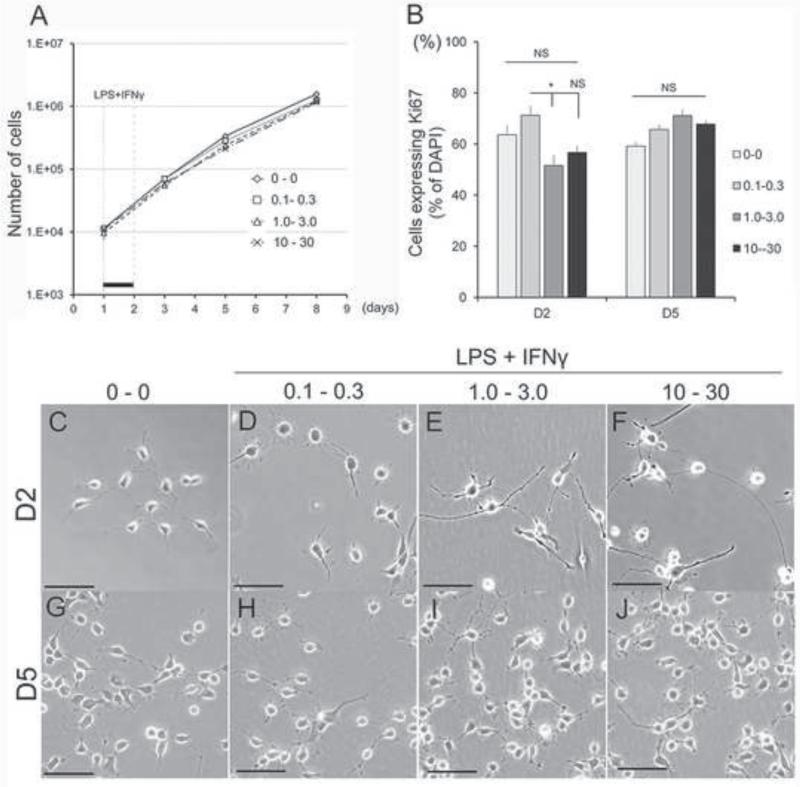
Figure 3.
Effect of LPS/IFNɤ on GRP morphology and proliferation. (A) Growth curve of GRPs after LPS/IFNɤ exposure. Black bar represents time window of LPS/IFNɤ treatment. (B) Quantitative analysis of Ki67+ cell population after LPS/IFNɤ treatment. Asterisk represents significant difference relative (*P<0.05). (C-J) Morphology of GRP at each time point after exposure to LPS/IFNɤ with different concentrations. Experiments were repeated for three times and representative data are shown in Figures as mean ± standard error of the mean (SEM). Statistical analysis was performed by one-way ANOVA with Bonferroni test. Scale bar = 50 μm.

