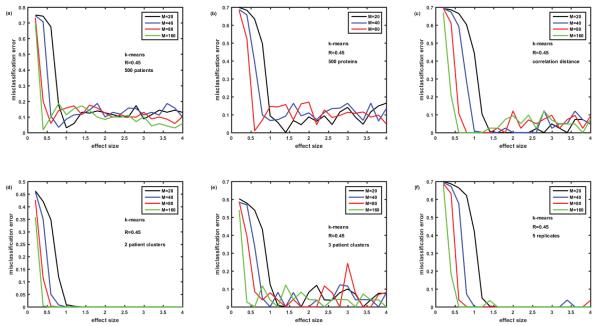
Figure 3.
Solving the ‘puzzle of k-means behavior’. Attempts to reduce misclassification errors generated by k-means at large effect sizes (see oscillations around 10% error rates in Figure 2). Figure 3A- number of patients increased from 100 to 500; 3B- number of proteins reduced from 1129 to 500; 3C- correlation distance used instead of Euclidian distance; 3D – number of patient clusters reduced from 5 to 2; 3E- number of patient clusters=3; 3F-K- means settings are changed from default (no replicates) to 5 replicates – problem solved.

