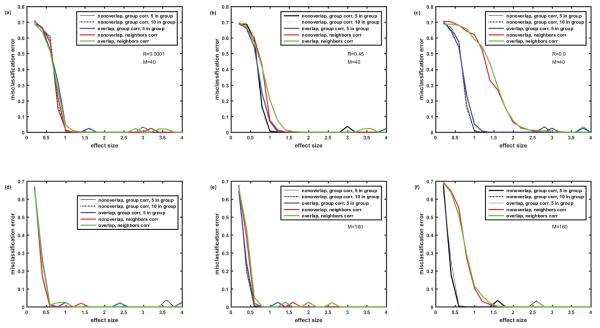
Figure 7.
Misclassification error rates generated by k-means algorithm. Cohort of 100 simulated patients (5 clusters of equal size). Protein assay includes 1129 target proteins. Comparison of 5 cases: (1)-non-overlapping signatures, correlation R within group of 5 proteins; (2)- non- overlapping signatures, correlation R within group of 10 proteins; (3)- completely overlapping signatures, correlation R within group of 5 proteins; (4)- non-overlapping signatures, ‘among neighbors’ correlation of proteins Rij=R∣i-j∣; (5)-completely overlapping signatures, ‘among neighbors’ correlation of proteins Rij= R∣i-j∣. Values of M and R are the same as in Figures 2, 4-6.

