
Figure 4.
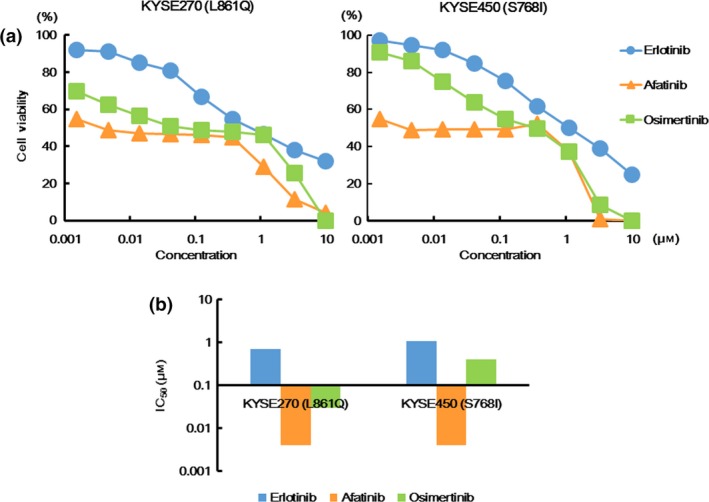
Sensitivities to various EGFR‐TKI in the KYSE270 and KYSE450 cell lines. (a) Growth inhibitory curves of various EGFR‐TKI in the KYSE270 and KYSE450 cell lines. The cells were exposed to each concentration of various EGFR‐TKI for 72 h, and the growth inhibitory effects were evaluated using an MTT assay. Both the KYSE270 (L861Q) and KYSE450 (S768I) cell lines were most sensitive to afatinib and least sensitive to erlotinib. Osimertinib was as effective for the KYSE270 cell line as afatinib, but was much less effective for the KYSE450 cell line than afatinib. Lines, mean of independent triplicate experiments. (b) IC50 values of various EGFR‐TKI in the KYSE270 and KYSE450 cell lines. The IC50 values of erlotinib, afatinib and osimertinib in the KYSE 270 cell line (L861Q) were 0.7, 0.004 and 0.03 μM, respectively, while those of erlotinib, afatinib and osimertinib in the KYSE 450 cell line (S768I) were 1.1, 0.004 and 0.4 μM, respectively.