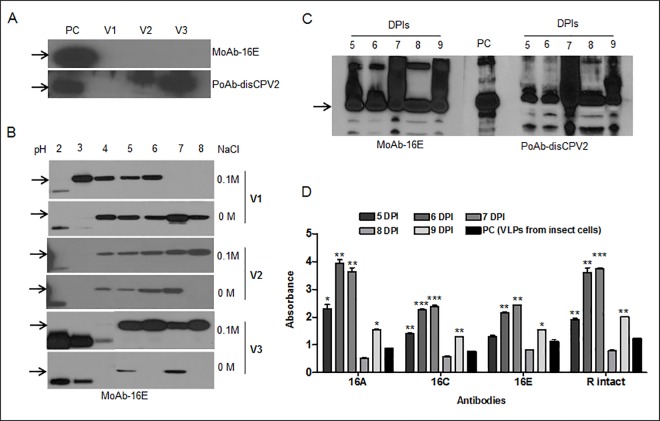
Fig 2. The detection profile and quantification analysis of L1 protein extracted from transformed tobacco plants.
The immunoblots represent the HPV16 L1 detection profile of different vector-infiltrated plants extracted with (A) HEPES buffer, (B) using different physiological conditions with pH 2–8 in the presence (WS) or absence of salt (NS), (C) extraction of HPV16 L1 protein with PBS buffer at 5–9 days post infiltration (DPI) from plant leaves infiltrated with construct (TPL1F; V3). Antibodies, MoAb-16E and PoAb- disCPV2 were used for immunoblots. The positive control (PC) was disrupted VLPs from insect cells and arrows in immunoblots show HPV L1 band at 56 kDa. (D) Bar diagram of ELISA for VLPs extracted from crude plant extract (V3) at 5–9 DPIs. MoAbs-16 A, C and E and PoAb-R intact were used to detect specific sequential and conformational epitopes of HPV16 L1 and VLPs from insect cells were used as a positive control (PC). Student’s t-test was done to compare VLPs from plant extract at 5–9 DPIs with VLPs from insect cells. *p < 0.05; **p <0.01 and ***p <0.001.

