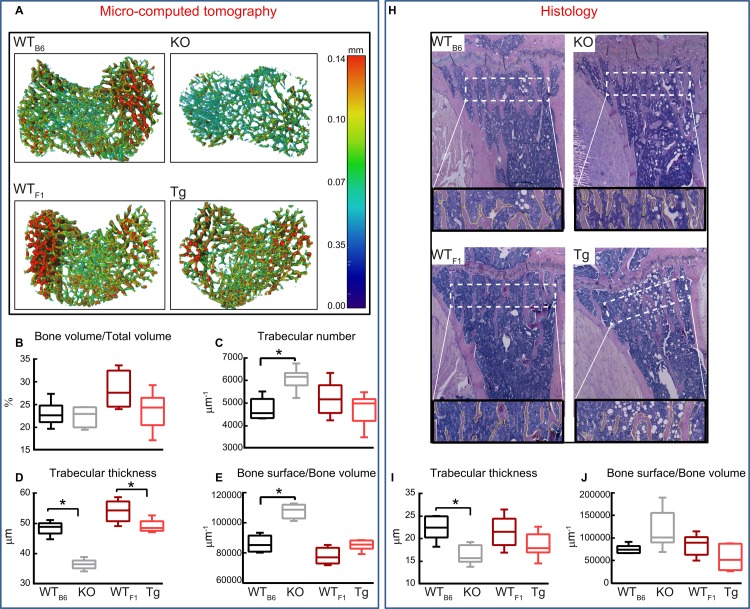
Fig 1. Deficiency and also transgenic overexpression of Timp-3 generate defects in trabecular bone.
Trabecular bone phenotype of WTB6 (black), Timp-3 KO (grey), WTF1 (dark red), Timp-3 Tg (light red) tibia at 8 weeks of age. (A) Representative 3D Micro-CT thickness colour-coded images of tibial trabecular bone. Ex vivo high-resolution analyses of distal proximal metaphysical tibia to determine (B) trabecular bone volume/total volume, (C) trabecular number, (D) trabecular thickness and (G) bone surface/bone volume. (H) Representative Alcian blue haematoxylin and orange G/eosin stained sections with outline of trabeculae showing the region of interest used for measurements. These sections were analysed using Osteoid Histo to provide (I) trabecular thickness and (J) trabecular bone surface/bone volume. Box-plots represent means ± SEM. Group sizes for Micro-CT (B-G) were n = 5 for WT littermates and n = 6 for Timp-3 KO and Tg mice. Group sizes for histological data (I-L) were n = 4 for all groups. Two-sample t-test was used to compare means between KO and WTB6, and between Tg and WTF1. Normality of variance assumption was violated for total area of KO group (E) and homogeneity for trabecular thickness of WT vs. KO group (I) (p > 0.05), thus, for these groups Kruskal-Wallis test was performed. Statistical comparisons: * denotes p ≤ 0.05.

