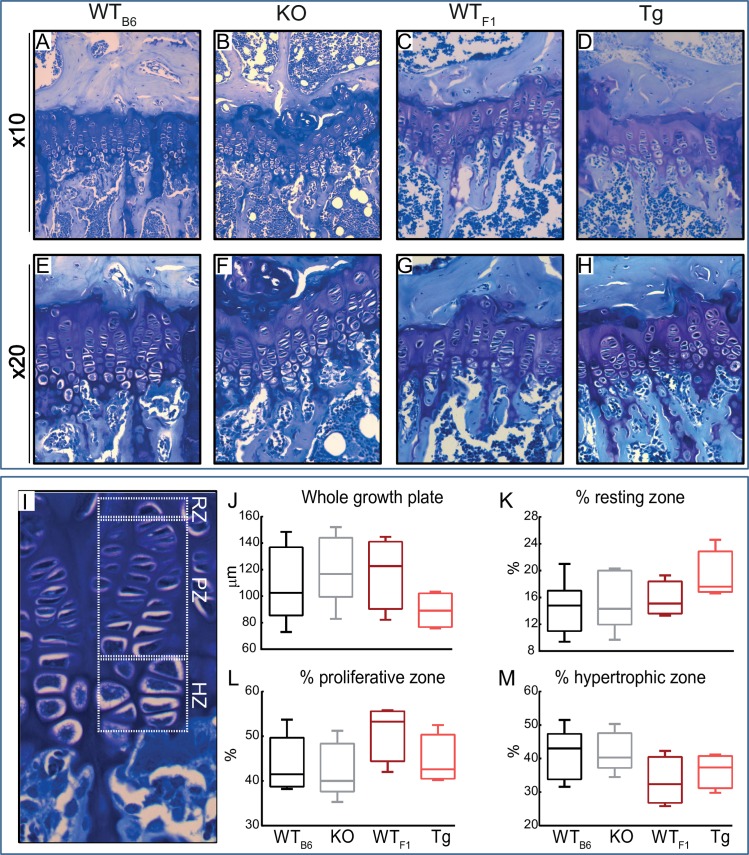
Fig 2. Timp-3 deficiency and transgenic chondrocyte-specific overexpression do not alter thickness of different zones in growth plate.
Representative images of toluidine blue stained sections from WTB6 (A and E), KO (B and F), WTF1 (C and G) and Tg (D and H) mice showing overall structure of growth plate measured from resting zone to primary spongiosa. (I) Different zones of growth plate were marked and measured. No significant differences in size overall size of growth plate (J), percent proliferative zone (K), percent hypertrophic zone (L) and percent resting zone (M) between KO and their WT controls as well as Tg and their respective WT were observed. Two-sample t-test was used to compare means between KO and WTB6, and between Tg and WTF1. Normality and homogeneity of variance assumptions were not violated in any experimental group (p ≥ 0.05). Group sizes were n = 4. Data are mean ± SEM.

