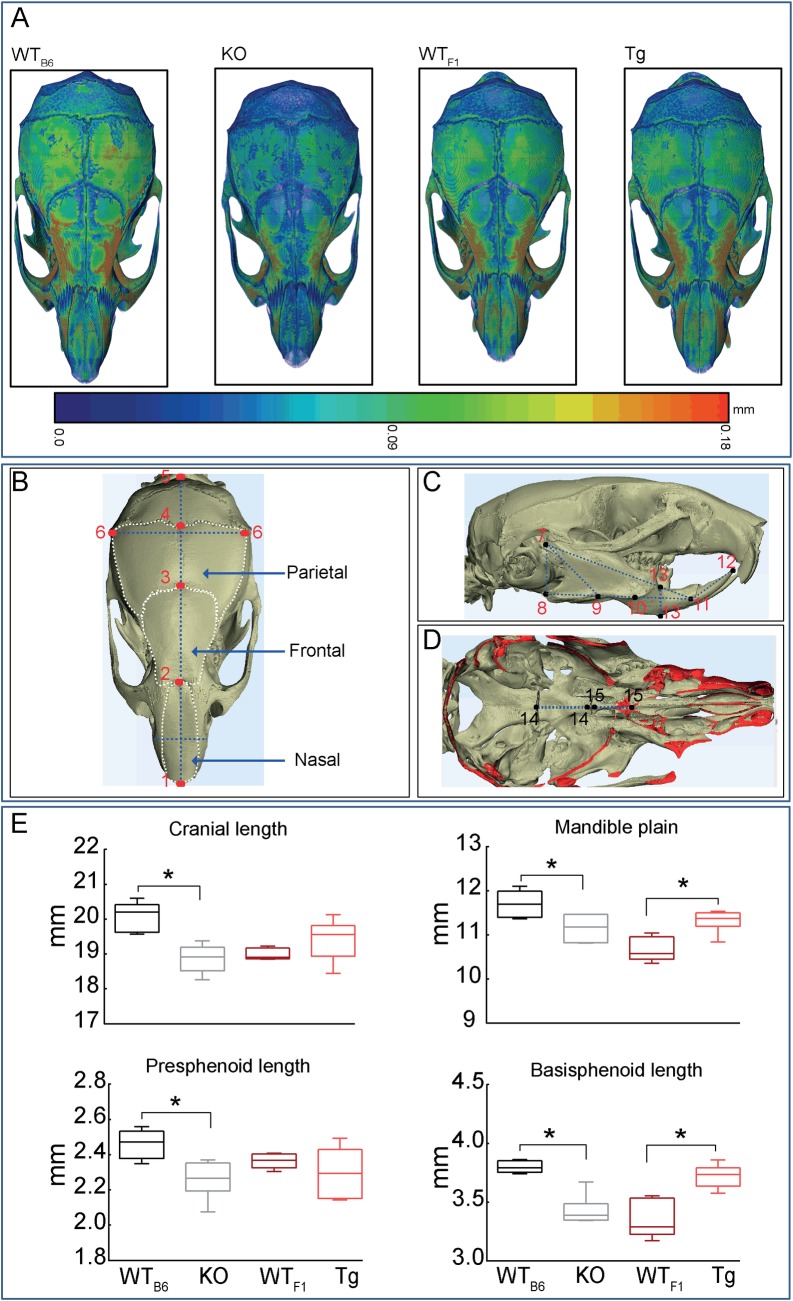
Fig 6. Timp-3 deficiency and overexpression produce architectural changes in the skull.
Craniometric measurements of WTB6, Timp-3 KO, WTF1 and Timp-3 Tg skull at 8 weeks of age. (A) Representative 3D Micro-CT colour-coded images of skull thickness. (B) Schematic of the structures of the mouse skull depicting landmarks used to obtain measurements in the cranial; 1–2: nasal length, 2–3: frontal length, 3–4: parietal length, 1–5: cranial length, 6–6: bitemporal distance, (C) 7–8: posterior mandible height, 7–9: condilar axis, 7–11: effective mandible length, 8–11: mandible plain, 9–10: mandible axis, 11–12: inferior incisor axis, 13–13: (D) anterior mandible height, 14–14: basisphenoid length, and 15–15: presphenoid length in which the ‘shell’ regions of the bone that correspond to plane of sectioning are coloured in red. (E) Cranial length, mandible plain, presphenoid and basisphenoid length. Box-plots represent means ± SEM. Group sizes were n = 5. Statistical comparisons: * denotes p ≤ 0.05.

