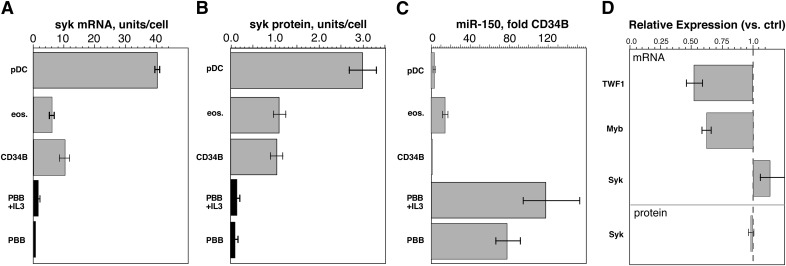
Figure 4. A comparison of Syk mRNA and protein levels in 4 cell types (including 2 culture conditions for PBBs).
(A) eos, eosinophils (n = 4), pDCs (n = 4), CD34B (n = 3), PBBs, basophils with or without IL-3 (n = 4). The results were normalized to number of cells used in the microarray and are expressed relative to expression in PBB (1 U/cell). (B) The results for Syk protein are abstracted from an earlier study [20]. (C) Relative levels of expression of miR-150 for the same cell types. (D) Changes in TWF1 mRNA (using miR-1 positive control reagent for transfection), c-Myb or Syk mRNA (using miR-150 for transfection) relative to transfection with negative control (scrambled) miR-treated cells. The bottom bar shows the absence of change in Syk protein.

