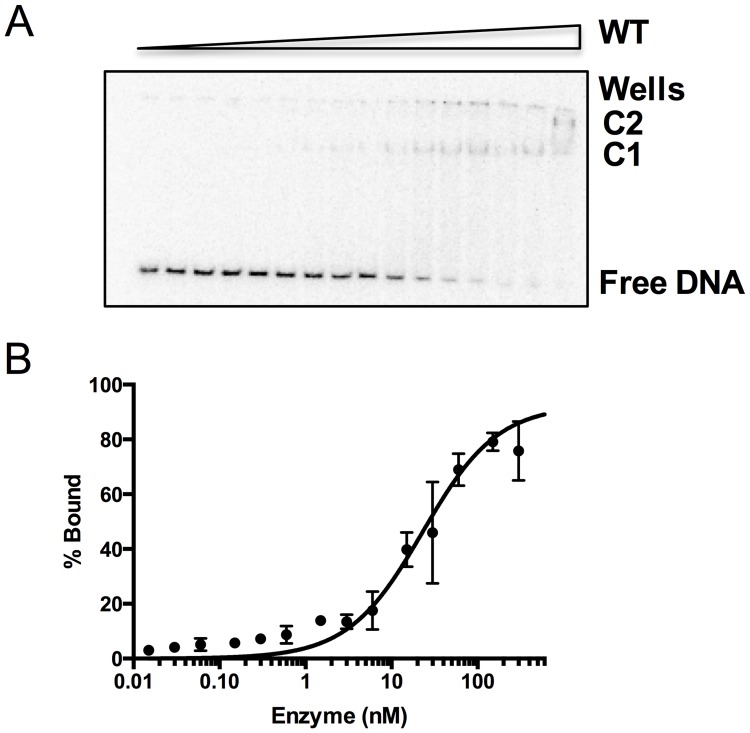
Fig 4. Binding of NEIL1 and mutant enzymes to DNA.
(A) Representative phosphor-autodiogram for binding of NEIL1-WT to a 35-mer furan-containing DNA where the substrate (10 pM) was incubated with increasing (0–600 nM) amounts of enzyme. Complex formation is indicated by the presence of shifted bands C1 and C2. (B) Graphical fitting of the EMSA data indicated above using GraphPad Prism 6. The data were fit to the one-site specific binding equation. The Kd values for WT and the NEIL1 mutants are listed in Table 1 and are representative of experiments performed in duplicate.

