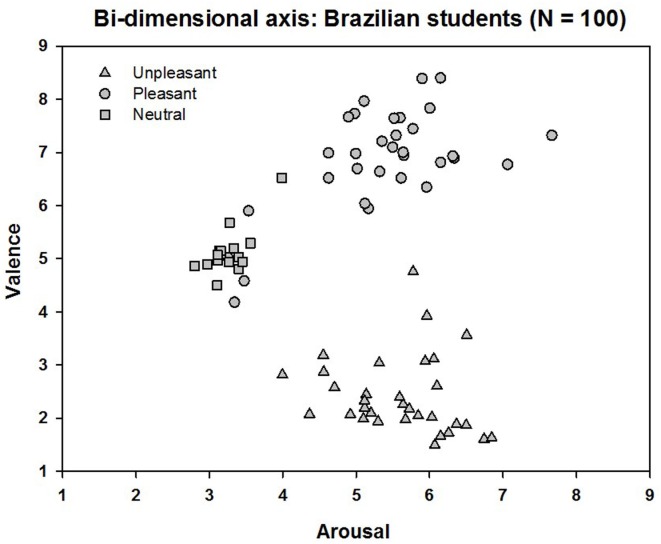
Fig 1. Affective space: bi-dimensional plot of each image as a function of its mean hedonic valence (y axis) and arousal ratings (x axis).
Each point in the graph represents the mean rating for each picture given by all students (N = 100). Participants judged 80 IAPS images. IAPS unpleasant pictures (triangles); pleasant pictures (circles); neutral pictures (squares).

