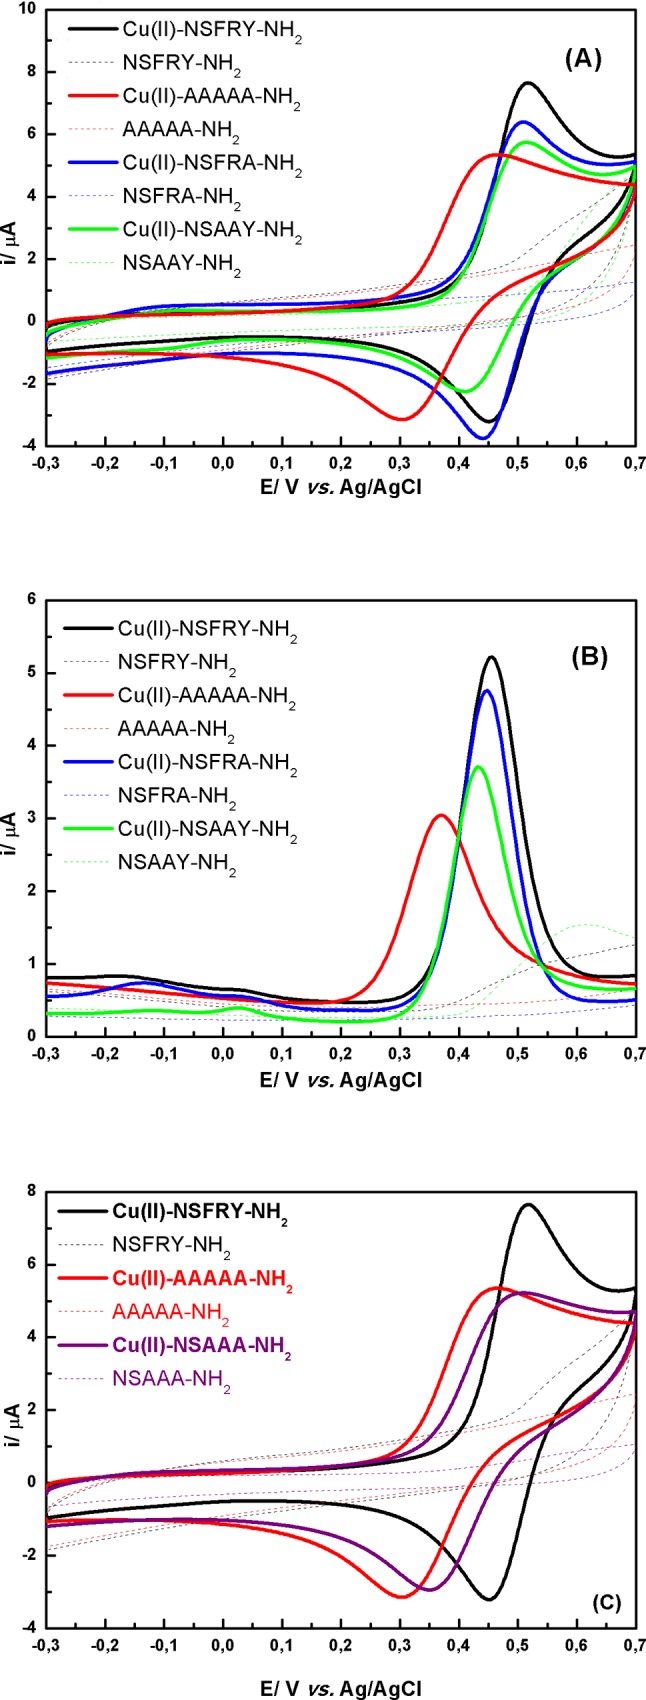
Fig 3.

(A), (C) Cyclic and (B) DP voltammograms recorded in 0.5 mM aqueous solution of Cu(II)-peptide complexes (solid lines) and free peptides (dashed lines) at pH 9.0. Only in the case of Cu(II)-AAAAA-NH2 complex (red line) and AAAAA-NH2 peptide (red dashed line) the measurements were performed at pH 11.0.
