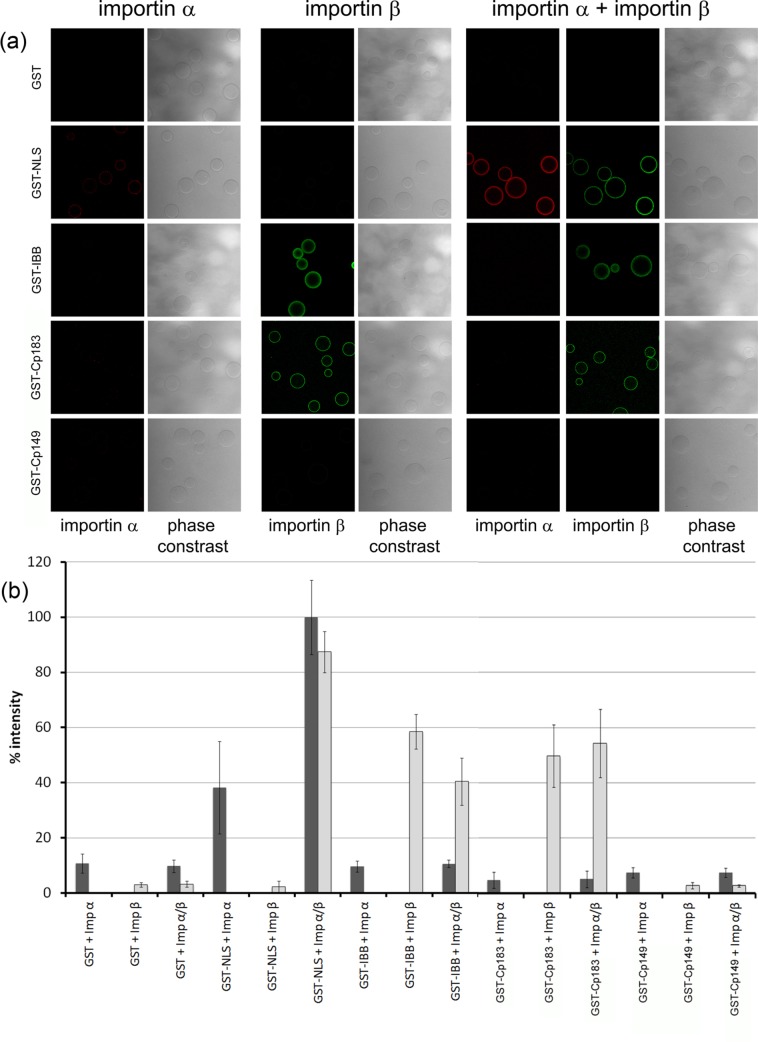
Fig 9. Importin β interaction with GST-Cp183 fusion protein.
(a) Confocal fluorescence microscopy of importin α-Alexa594 and importin β-Alexa488 with glutathione sepharose, coated with different GST fusion proteins. The protein coating the beads is indicated on the left. The importins in the binding reaction are shown at the top of the figure; the read out channel on the bottom. (b) Quantification of the fluorescence. Importin α: dark grey bars, importin β: light grey bars. The bars give the average of three independent experiments; the ranges are indicated. Y axis: % relative to the mean of importin β binding to GST-NLS; x axis: upper row–importin in the binding reaction, lower row–substrate on the beads.

