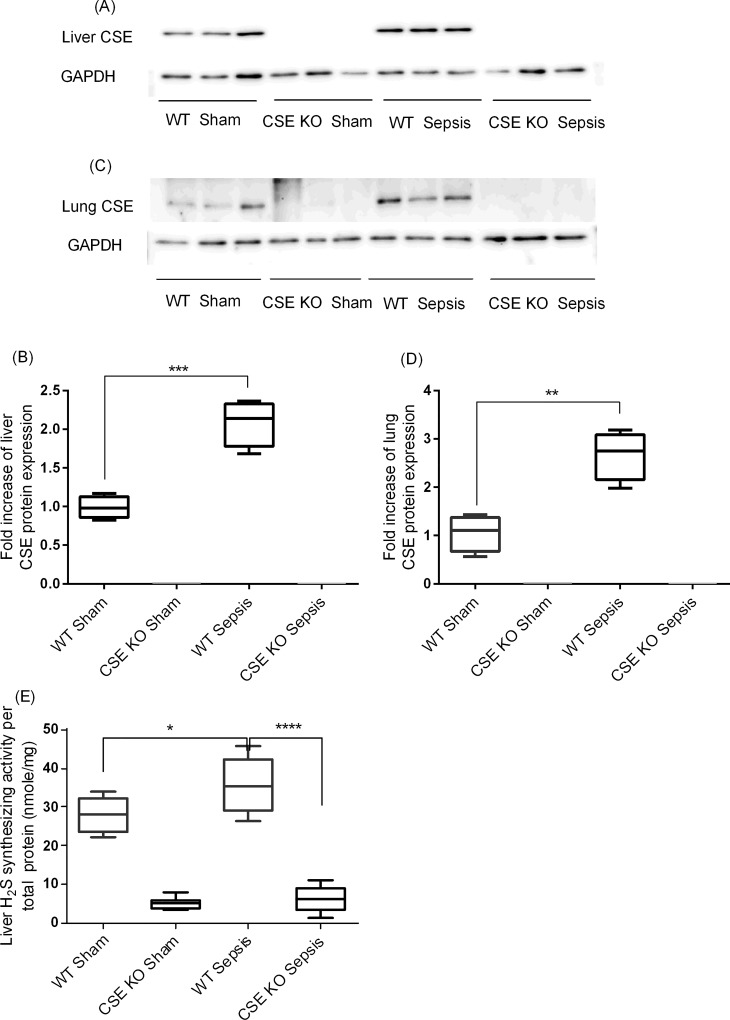
Fig 1. CSE Protein Expression and H2S-Synthesizing Activity Following CLP Induced Sepsis.
(A-B) Liver CSE protein expression and (C-D) lung CSE protein expression. Liver and lung CSE protein expression was increased following CLP induced sepsis compared to sham control (liver: P<0.001 vs. sham control; lung P<0.01 vs. sham control) and no CSE protein expression was detected in CSE KO mice. Results were normalized with GAPDH and expressed as the relative fold increase of CSE protein expression compared with sham control. For western blot results, each lane represents a separate animal. The blots shown were representative of all animals in each group with similar results. (E) Liver H2S synthesizing activity. H2S synthesizing activity was increased following increased CSE protein expression in WT CLP induced sepsis mice compared to sham controls and CSE KO mice had significantly lower H2S synthesizing activity compared to WT sepsis mice. Data represent the mean±standard deviation (n = 8). Data were analysed for Gaussian or Normal distribution using Shapiro-Wilk test. One-way ANOVA with post hoc Tukey’s test was performed to compare multiple groups. Statistical significance was assigned as *P<0.05; **P<0.01; ***P<0.001; and ****P<0.0001.

