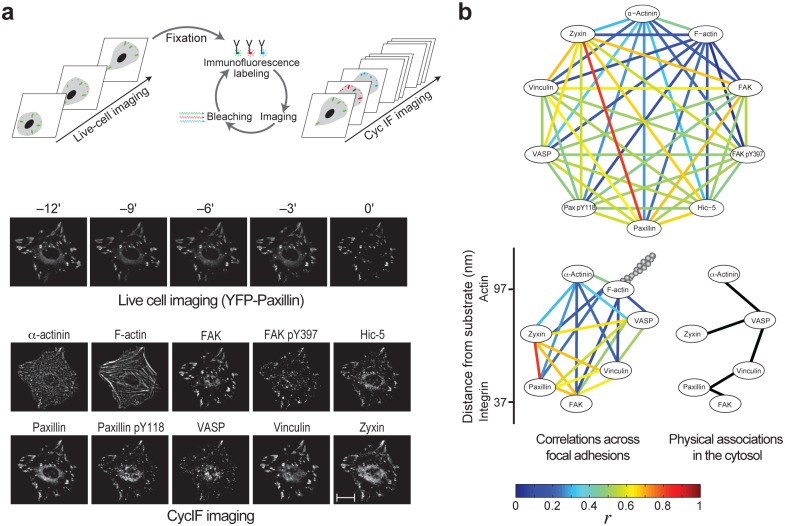
Fig 1. High-throughput CycIF imaging of cell-matrix adhesion sites.
(a) Imaging procedure and an example of the images obtained for a cell. Scale bar, 10 μm. (b) Top, the mean Pearson correlation coefficients (r, n = 6 datasets; see S2 Table) between the densities of the components. Bottom, superposition of these correlations with the reported vertical positions of the components across focal adhesions [26] (left) and a comparison with their reported physical associations in the cytosol [33] (right).

