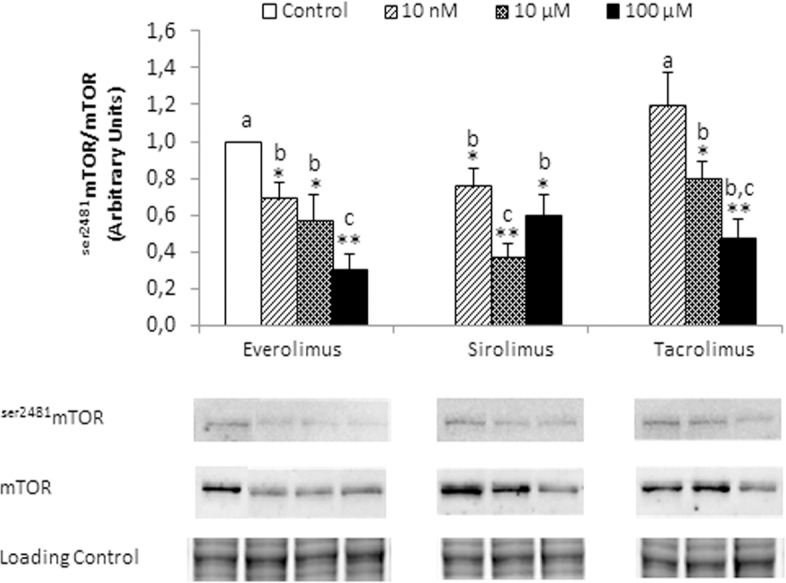
Fig 1. Ser2481mTOR/mTOR ratio in HepG2 treated with Everolimus, Sirolimus and Tacrolimus.

The expression of Ser2481mTOR and mTOR was assessed at 6 hours after treatments (0, 10 nM, 10 μM and 100 μM) by Western-blot analysis. Data are expressed as mean ± SEM. The groups with symbol are statistically different (*p≤0.05 or **p≤0.01) compared with their corresponding control. The groups with different letter (a, b or c) were significantly different (p ≤ 0.05) compared to other groups. The images are representative of four independent experiments.
