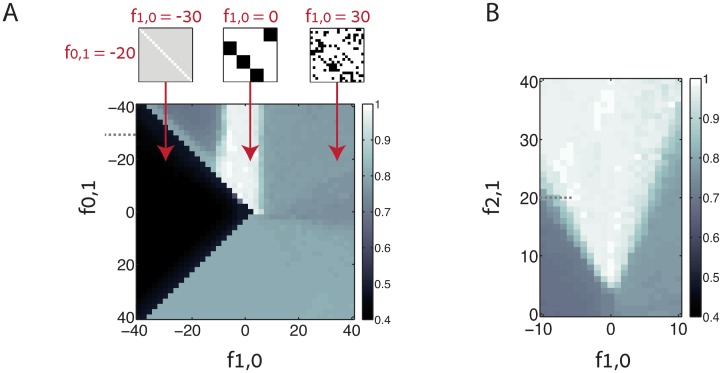
Fig 6. Chain score of the steady state connectivity, obtained from simulations that include selected motifs.
A. Density plot of the chain score, displayed as a function of the motif coefficients f1,0 (horizontal axis) and f0,1 (vertical axis). All other motif coefficients are kept fixed. Note that here f2,1 = 20 (designated by a dotted line in panel B). Above: examples of steady state connectivity matrices for f0,1 = −20, and (from left to right) f1,0 = −30, 0, 30. B. Chain score as a function of the motif coefficients f1,0 (horizontal axis) and f2,1 (vertical axis) with all other motif coefficients kept fixed. Here f0,1 = −30 (designated by a dotted line in panel A). Each data point represents an average over ten simulations, each with a different realization of the initial random connectivity. Additional details of the plasticity dynamics are specified in Methods.

