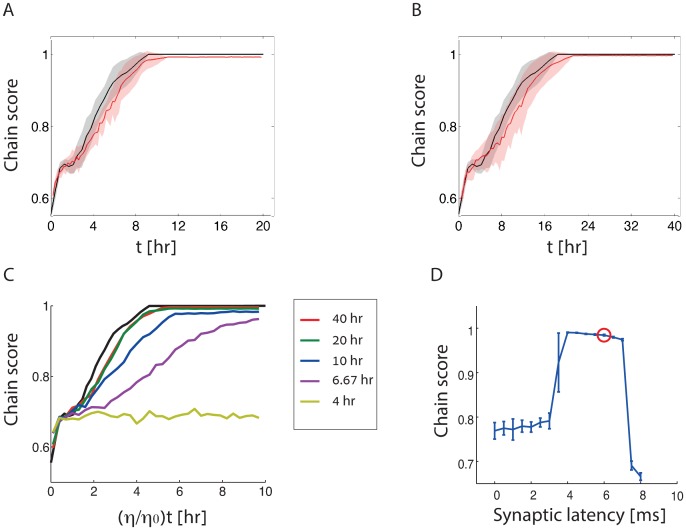
Fig 8. Formation of synfire chains under stochastic dynamics.
A-B. Evolution in time of the chain score in the stochastic dynamics (red), compared with the prediction of the deterministic theory (black), shown for two different learning rates: η = 2 × 10⁻⁷ (A) and η = 1 × 10⁻⁷ (B) (see Methods for all other parameters). Solid traces: average over ten initial conditions. Limits of the shaded areas represent the standard deviation. Note the different time scales in A and B. C. Evolution in time of the chain score, shown for different learning rates (η) as a function of the time multiplied by η/η0 where η0 = 4 × 10⁻⁷. Each trace represents an average over ten random intial conditions, with a specific learning rate: η = 10−7 (red), 2 × 10⁻⁷ (green), 4 × 10⁻⁷ (blue), 6 × 10⁻⁷ (purple), and 10 × 10−7 (yellow). The black trace represents the prediction of the deterministic theory. Note that the traces for the smallest learning rates (green and red traces, corresponding to panels A and B, respectively) nearly collapse on a single line, in close agreement with the prediction of the deterministic theory. The legend shows the actual time corresponding to the right end of the horizontal axis for each one of the plots. The synaptic latency d = 6 ms. D. Chain score evaluated in simulations of the stochastic dynamics, shown as a function of the synaptic latency (the red circle corresponds to the synaptic latency in panel C). The learning rate η = η0 = 4 × 10⁻⁷, matching the blue trace in panel C. Each data point represents an average over ten simulations with random initial conditions, and the error bars represent the standard deviation. The chain score is evaluated after 60 hours of simulated time.

