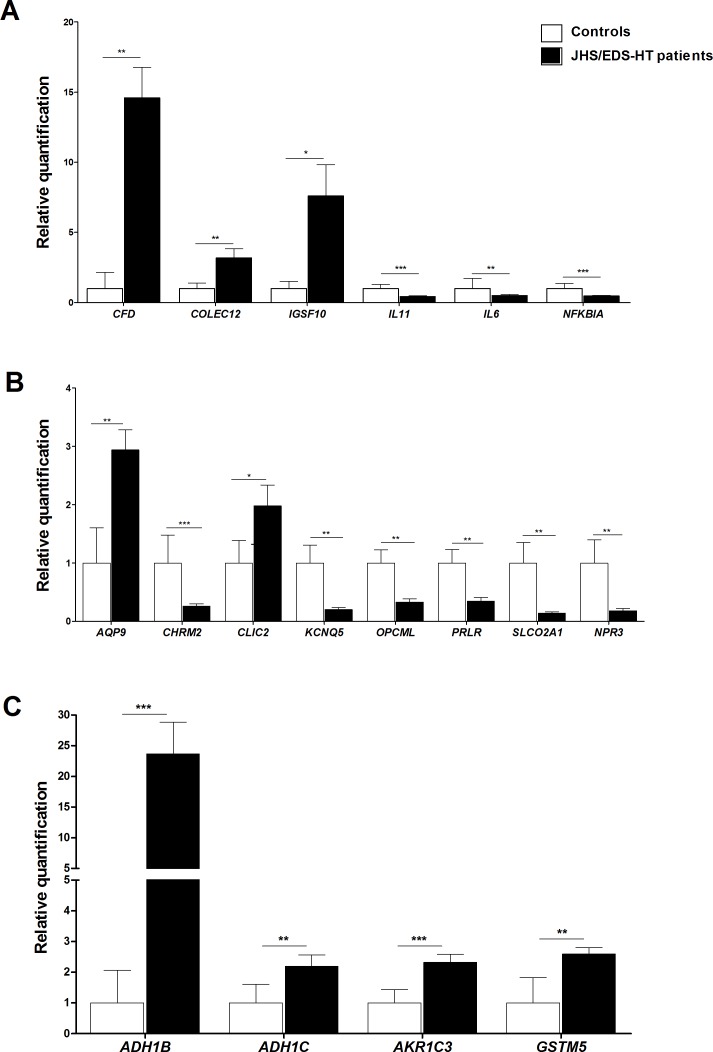
Fig 3. qPCR validation of genes involved in immune and inflammatory responses, signal transduction and energetic/redox homeostasis.
(A) The relative mRNA expression levels of selected genes related to immune and inflammation responses, (B) signal transduction, and (C) to energetic/redox homeostasis, were determined with the 2-(ΔΔCt) method normalized with the geometric mean of the five housekeeping genes. Bars represent the mean ratio of target gene expression in five patients’ fibroblasts compared to five unrelated healthy individuals. qPCR was performed in triplicate, and the results are expressed as mean ± SEM. Statistical significance was calculated with one sample t test (*p<0.05, **p<0.01 and ***p<0.001).

