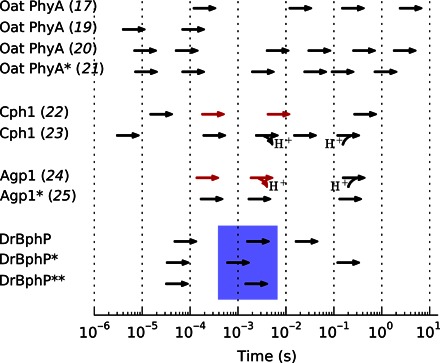
Fig. 2. Spectroscopic photoconversion in plant, cyanobacterial, and bacterial phytochromes.

Proton release and uptake are marked. Red arrows signify a kinetic H/D isotope effect larger than 3/2. Asterisks mark N-terminal fragments (**PAS-GAF, *PAS-GAF-PHY); all other samples are full-length. DrBphP refers to the results of the present study (see figs. S1 and S2), and the blue box indicates the steps found to involve the main structural transformation.
