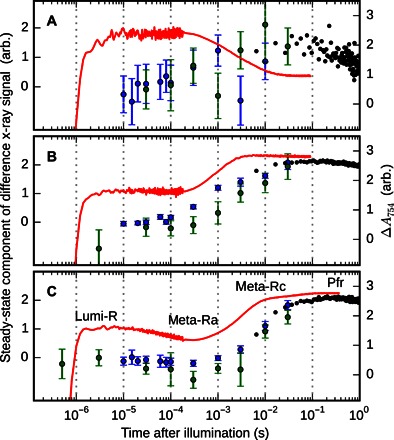
Fig. 4. Kinetics of photoconversion.

(A to C) Traces for PAS-GAF (A), PAS-GAFPHY (B), and full-length samples (C). For the transient absorption data, the absorbance at 754 nm is shown (red lines). For the x-ray data, the similarity of the time-resolved data to the “steady-state” component (the response between 500 ms and 1 s) is shown (circles). This is extracted as described in the Materials and Methods. Error bars represent 95% confidence intervals based on individual detector images. Blue, green, and black circles represent independent measurements performed at ID09b, BioCARS, and cSAXS, respectively. The half-times for the structural transitions are approximately 1, 2, and 6 ms for the PAS-GAF, PAS-GAF-PHY, and full-length constructs, respectively.
