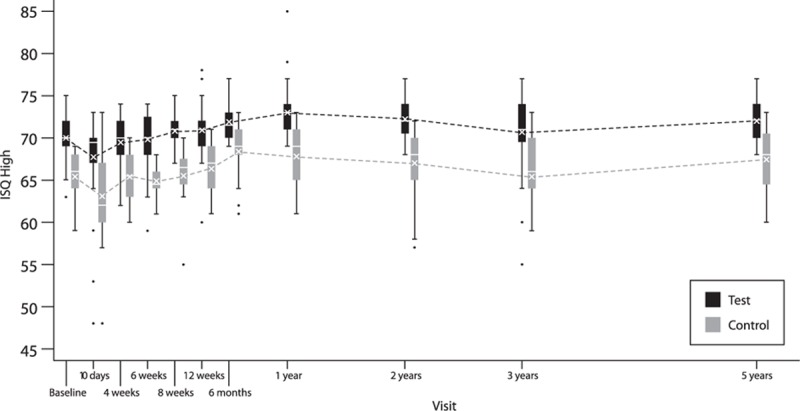
FIG. 2.

Box-and-whisker plot of ISQ high—lines represent ISQ high for patients who attended the 5-year follow-up. Mean (cross) and median (horizontal line) are defined within the boxplot. The box represents the interquartile range, the whiskers the 95% confidence interval and the single dots the outliers.
