FIG. 4.

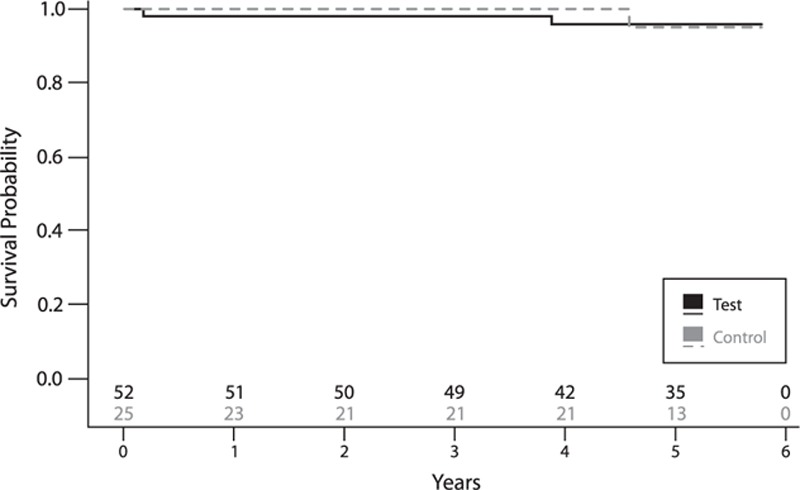
Implant survival, excluding explantations—lines represent the survival curve for both study groups. Numbers above x axis represent the numbers of patients at risk at the specific time point.

Implant survival, excluding explantations—lines represent the survival curve for both study groups. Numbers above x axis represent the numbers of patients at risk at the specific time point.