. 2016 Jun 22;5:e16030. doi: 10.7554/eLife.16030

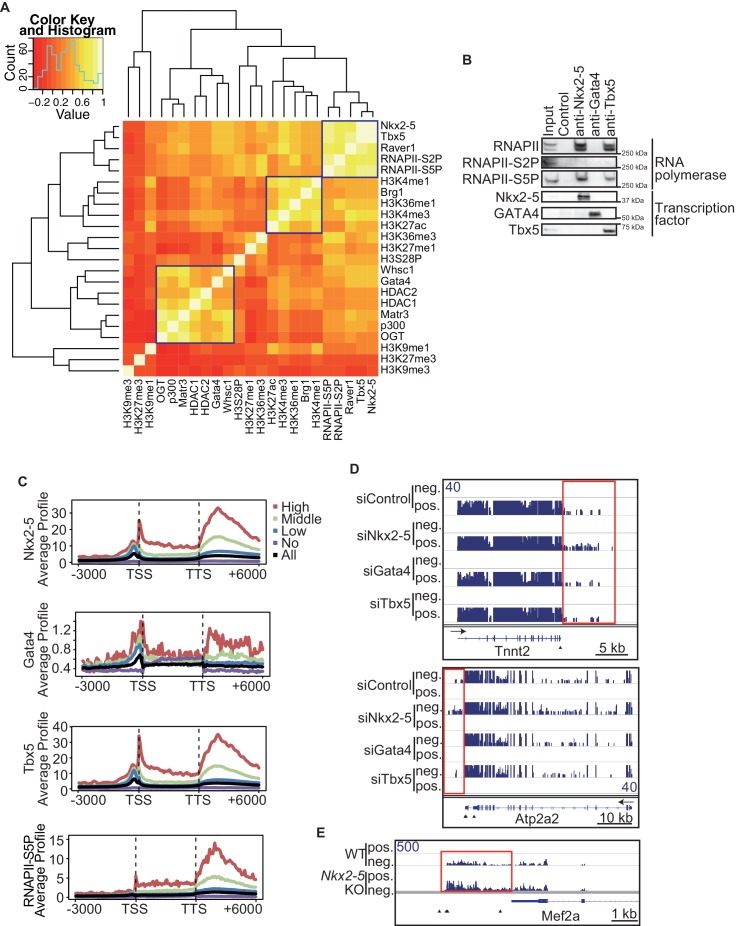
Figure 1. Nkx2-5 deficiency increases transcription from regions downstream of transcription termination sites.

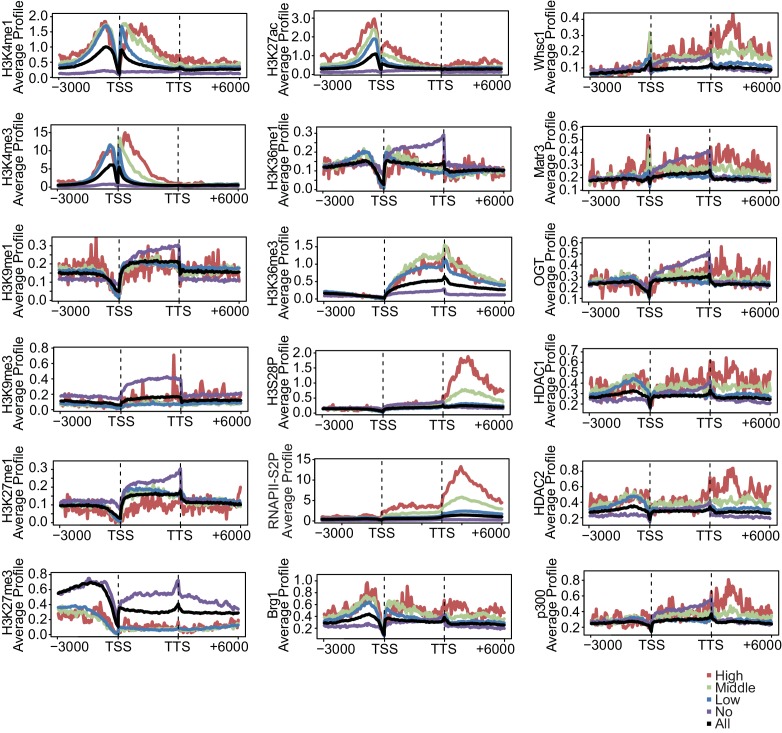
(A) Co-occupancies of each pair of factors and histone modifications are shown. White indicates a high correlation, and red indicates a low correlation. (B) Nkx2-5, Tbx5, and Gata4 were immunoprecipitated from nuclear extracts of E12.5 hearts with the indicated antibodies. Co-immunoprecipitates and aliquots (6%) of the input proteins were analyzed by Western blotting with the indicated antibodies. (C) Average ChIP-seq signal profiles over a 3-kb meta-gene, including 3 kb upstream and 3 kb downstream. The lines correspond to genes with High, Middle, Low, and No expression and all RefSeq genes. (D and E) Genome browser representation of strand-specific RNA-seq tag counts from eCMs transfected with the indicated siRNAs (D) and E9.5 Nkx2-5-/- hearts (E). The red boxes indicate read-through RNAs. neg., negative strand; pos., positive strand. The arrow heads show polyadenylation sites.

DOI: http://dx.doi.org/10.7554/eLife.16030.003

Figure 1—source data 1. Overlap of peaks between transcription factors and between the results from this study and those from previousely published studies.
(A) Overlap of peaks between Nkx2-5, Tbx5, and Gata4 ChIPseq data in this study. (B) Overlap of Nkx2-5 peaks among E12.5 hearts (this study), HL1 cells with BirA-fused Nkx2-5 (HL1_BirA) (He et al., 2011), and Adult hearts (van den Boogaard et al., 2012). (C) Overlap of Tbx5 between E12.5 hearts (this study) and HL1 cells with BirA-fused Tbx5 (HL1_BirA) (He et al., 2011). (D) Overlap of Gata4 peaks between native ChIPseq in this study and previousely published crosslink ChIPseq (He et al., 2014).
DOI: 10.7554/eLife.16030.004

Figure 1.

Figure 1—figure supplement 1. Transcription factors-associated proteins in E12.5 hearts.
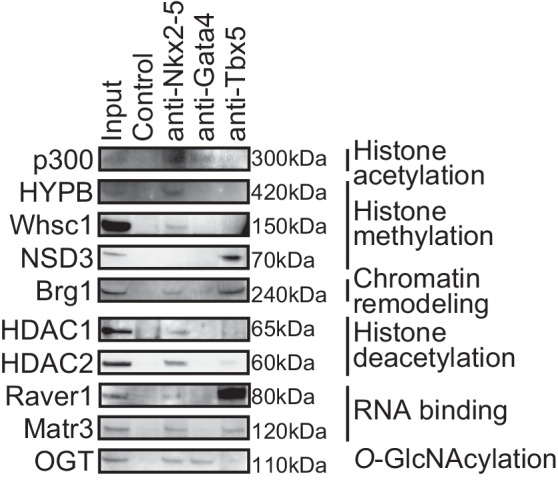
Figure 1—figure supplement 1.

This figure is related to Figure 1b.
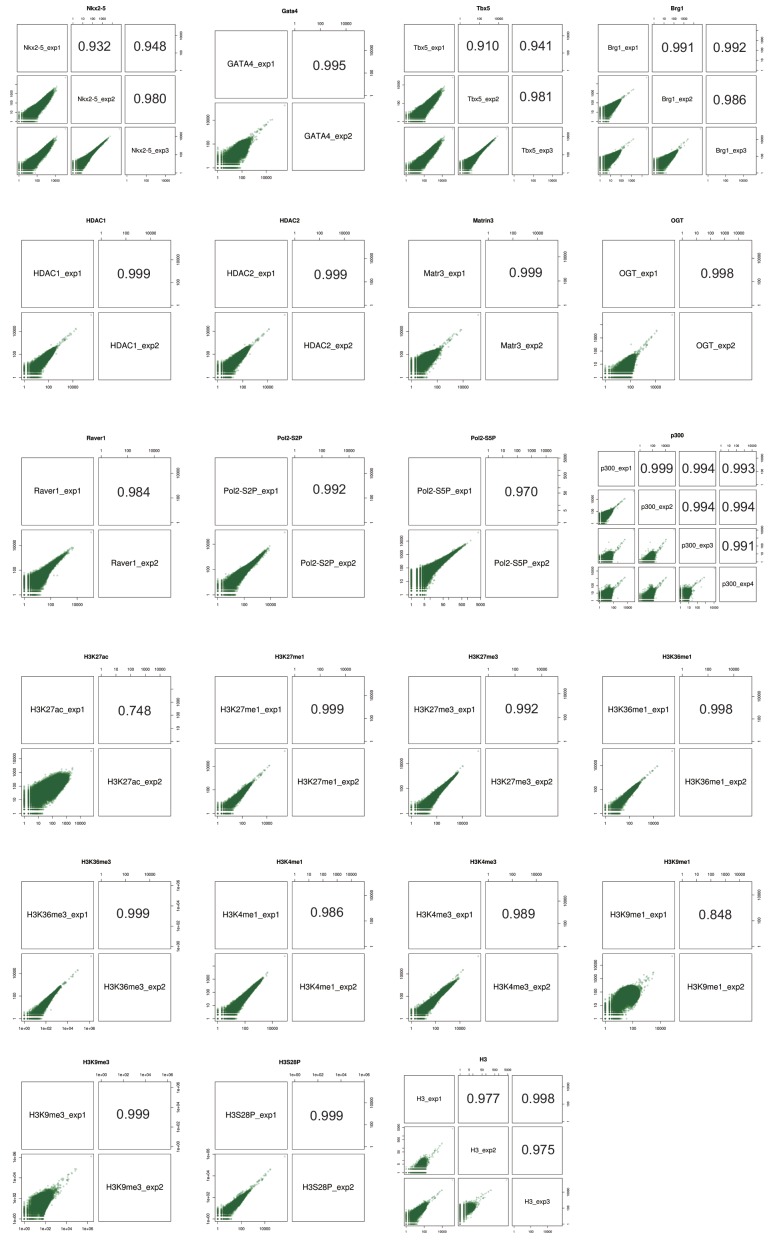
Figure 1—figure supplement 2. ChIPseq replicate correlations.

Figure 1—figure supplement 2.

Scatterplots of pair-wise ChIPseq replicates and Pearson correlation are shown.
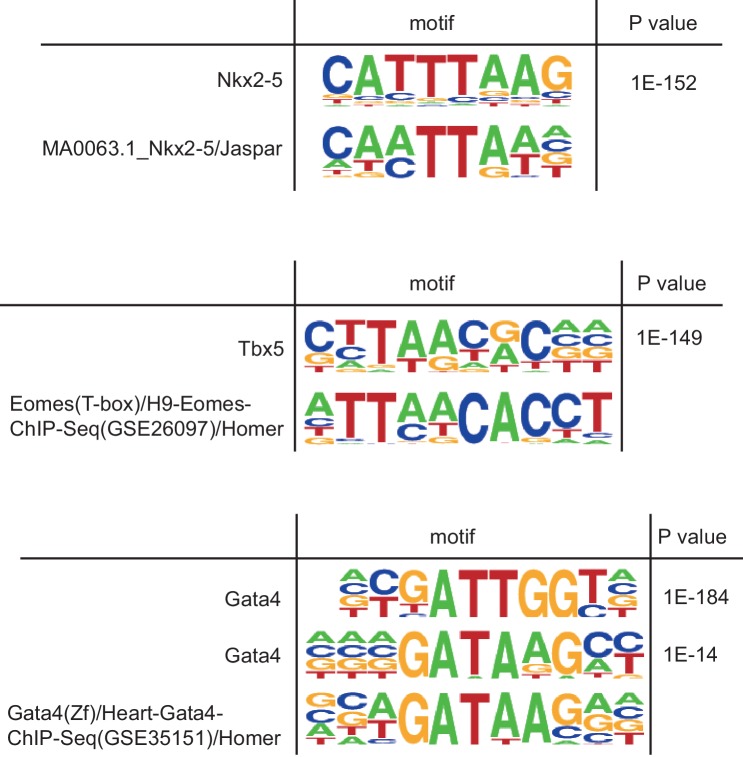
Figure 1—figure supplement 3. In vivo transcription factor binding motif by native ChIPseq.

Figure 1—figure supplement 3.

De novo motif analysis by Homer using all peaks in ChIPseq data. Obtained motifs are compared with the most matched known motif, respectively. The motif (T/C)GATTGG found in Gata4 peaks is similar to the motif TGATTG that Gata proteins strongly bind (Merika and Orkin, 1993).
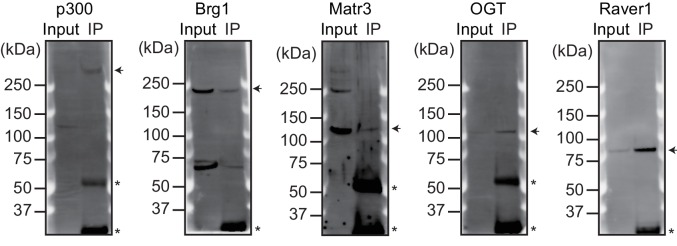
Figure 1—figure supplement 4. Validation of the antibodies used for ChIP-seq.

Figure 1—figure supplement 4.

The indicated proteins were immunoprecipitated from nuclear extracts of E12.5 hearts using the corresponding antibodies. Arrowheads indicate immunoprecipitated proteins. Asterisks indicate the IgG heavy or light chains.
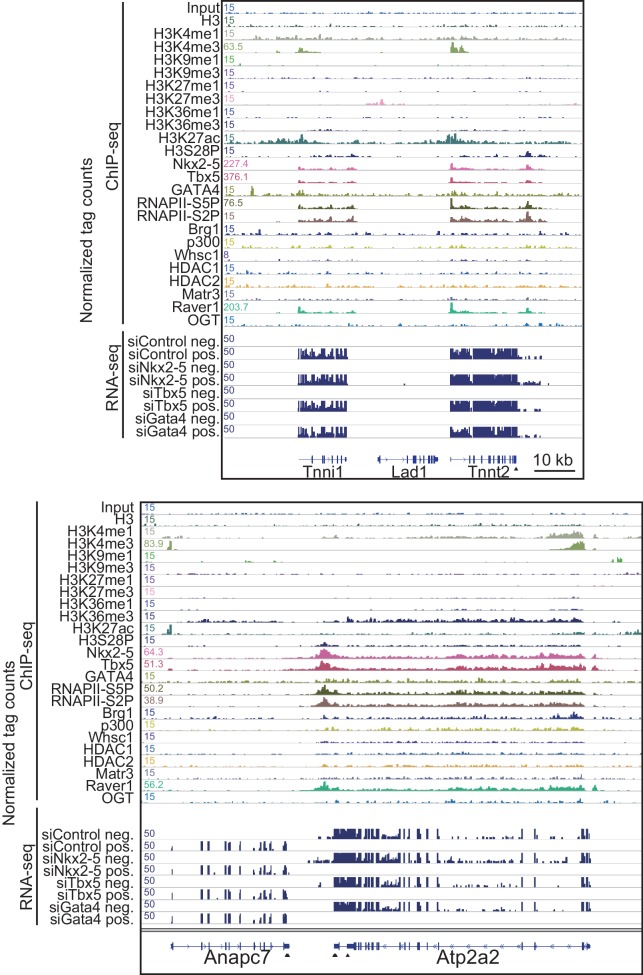
Figure 1—figure supplement 5. Genome browser representation at Tnnt2 and Atps2a2 loci.

Figure 1—figure supplement 5.

Genome browser representation of the indicated histone modifications, transcription factors, and transcription factor-associated protein enrichment profiles in E12.5 hearts is shown for the Tnnt2 and Atp2a2 loci, with strand-specific RNA-seq tag counts from eCMs transfected with the indicated siRNA. The arrow heads show polyadenylation sites.
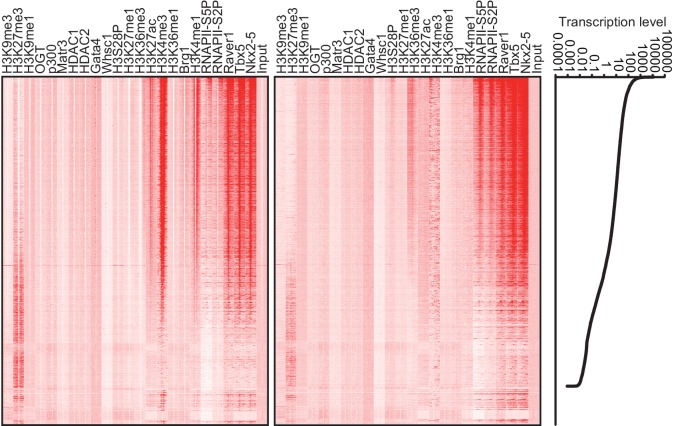
Figure 1—figure supplement 6. Heatmap of factor occupancy and histone modification enrichment for 8 kb regions centred on TSSs (left panel) and TTSs (middle panel) are shown with reference to the RefSeq gene expression level (right panel).

Figure 1—figure supplement 6.

Figure 1—figure supplement 7. Average signal profiles over a 3 kb meta-gene including 3 kb upstream and 3 kb downstream.

Figure 1—figure supplement 7.

The ChIP-seq data were analysed using CEAS. The lines correspond to genes with High, Middle, Low, and No expression and all RefSeq genes.
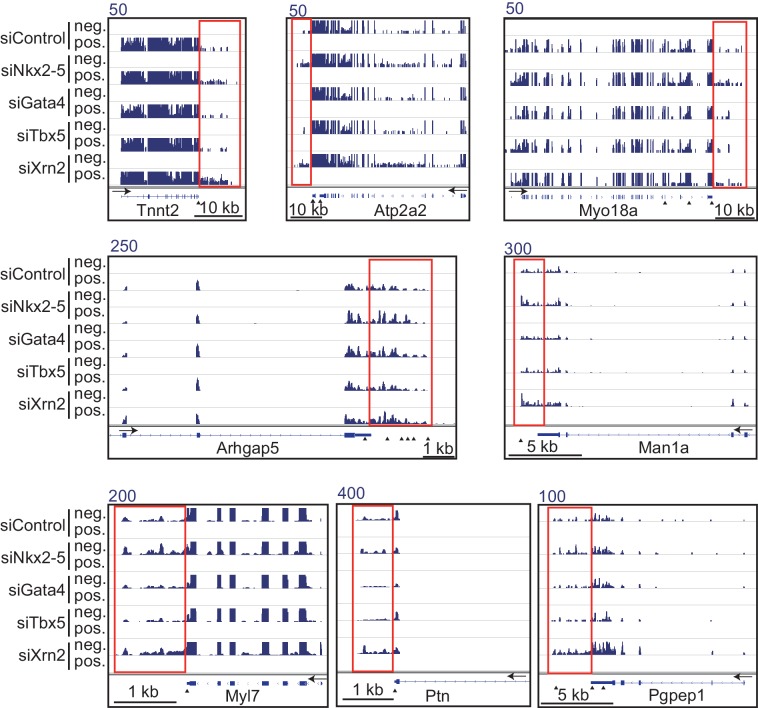
Figure 1—figure supplement 8. Genome browser representation of strand-specific RNA-seq tag counts from eCMs transfected with the indicated siRNAs.

Figure 1—figure supplement 8.

Red boxes indicate read-through RNAs. neg., negative strand., pos., positive strand. The arrow heads show polyadenylation sites.
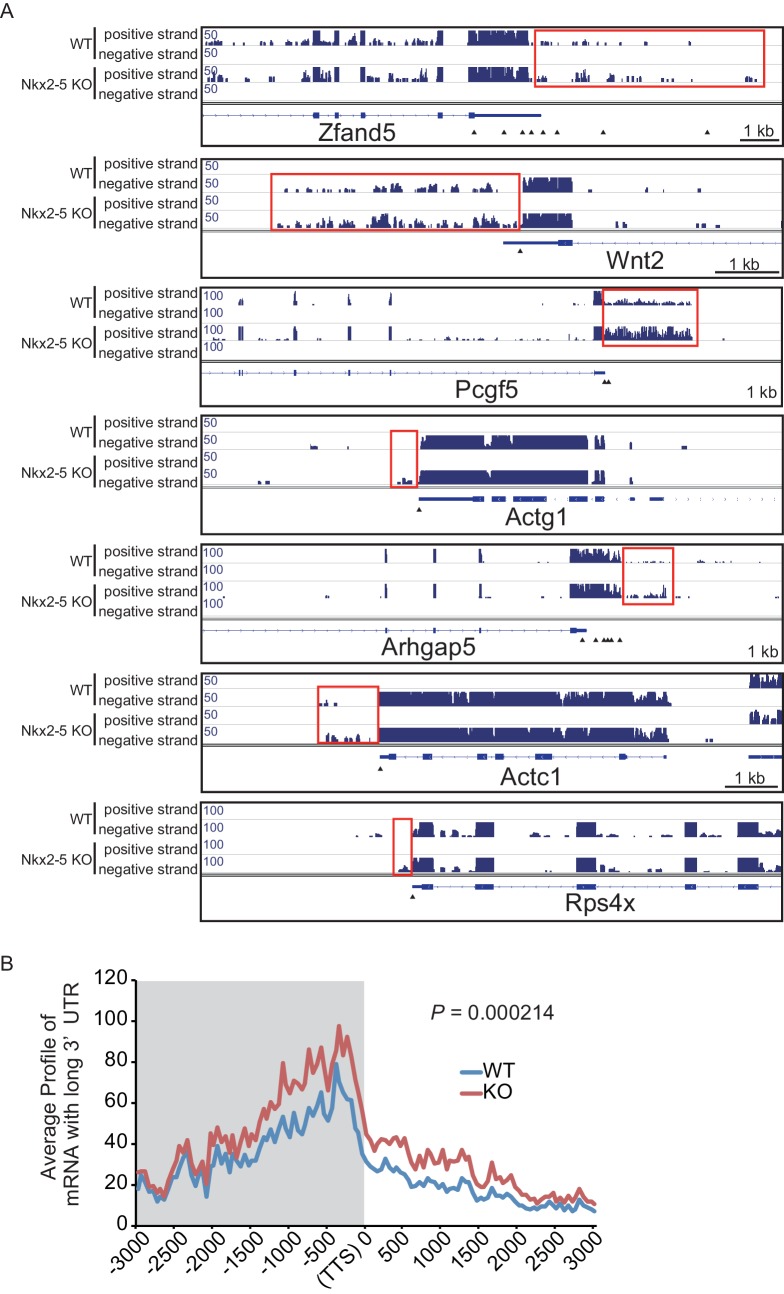
Figure 1—figure supplement 9. mRNA with long 3’UTR in Nkx2-5-knockout embryonic hearts.

Figure 1—figure supplement 9.

(A) Genome browser representation of the read-through RNAs in Nkx2-5-knockout embryonic hearts. Red boxes indicate long 3’UTR. The arrow heads show polyadenylation sites. (B) Average profiles of read-through RNAs that are increased in Nkx2-5-knockout embryonic hearts. Significance was assessed using the two-sample Kolmogorov-Smirnov test.