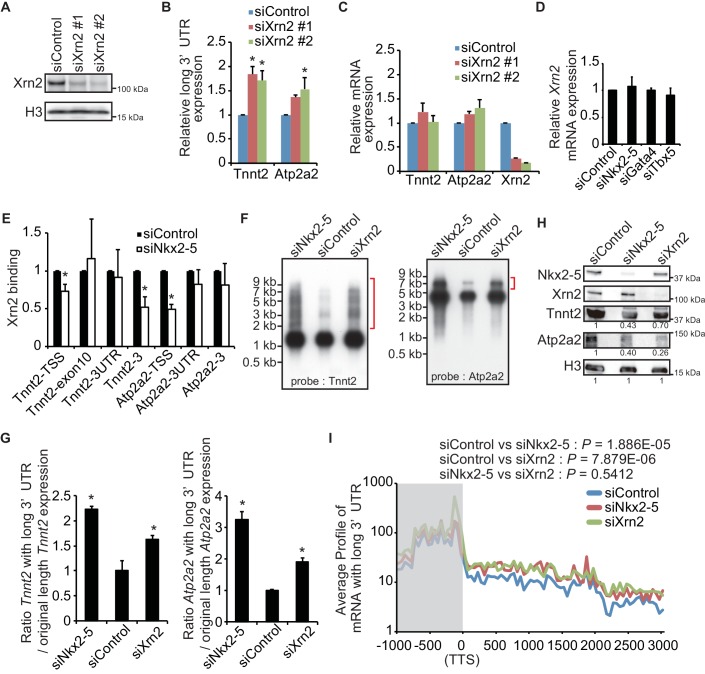
Figure 4. Nkx2-5 functions together with Xrn2 to regulate APA.
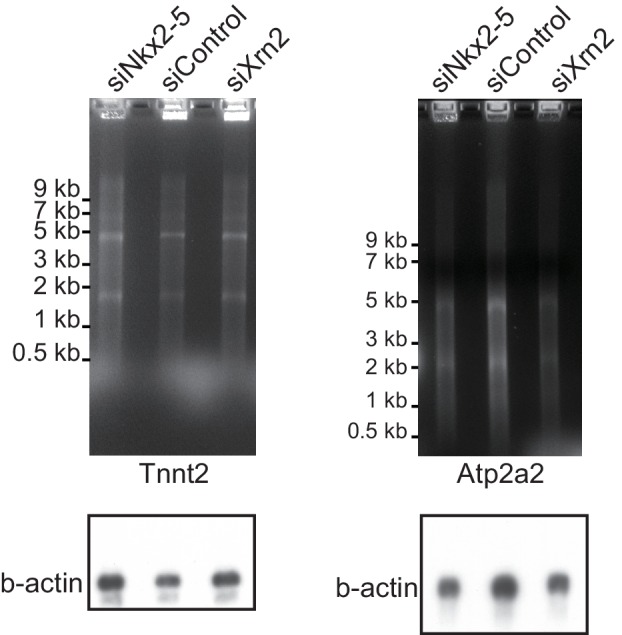
(A) Xrn2 knockdown was analyzed by Western blotting. (B and C) qRT-PCR analysis of mRNAs expression of the long 3’ UTRs (B) and gene bodies (C) of Tnnt2 and Atp2a2 in Xrn2-knockdown eCMs, normalized to Rplp2. (D) Xrn2 expression levels were measured by qRT-PCR and normalized to Rplp2. (E) Xrn2 binding in eCMs transfected with the indicated siRNAs was analyzed by ChIP-qPCR. The control values were set to 1.0. (F) Long 3’ UTRs in eCMs transfected with the indicated siRNA were analyzed by Northern blotting using probes against Tnnt2 and Atp2a2 mRNA. Red brackets indicate mRNAs with long 3’ UTRs. (G) The original lengths of the Tnnt2 and Atp2a2 mRNAs and the lengths of the Tnnt2 and Atp2a2 mRNAs with long 3’ UTRs that were used in the Northern blot analysis were measured by BAS5000. The ratio of the siControl was set to 1.0. (H) Tnnt2 and Atp2a2 proteins in Nkx2-5 and Xrn2 knockdown eCMs were analyzed by western blotting. (I) The average profiles of the mRNAs with long 3’ UTRs that were increased in Nkx2-5-knockdown eCMs are shown in eCMs transfected with the indicated siRNAs. The gray area indicates the coding region. Significance was assessed using the two-sample Kolmogorov-Smirnov test. For B, C, D, E, and G, error bars indicate the mean ± s.e.m. (n = 3). *, p < 0.05.
DOI: http://dx.doi.org/10.7554/eLife.16030.021
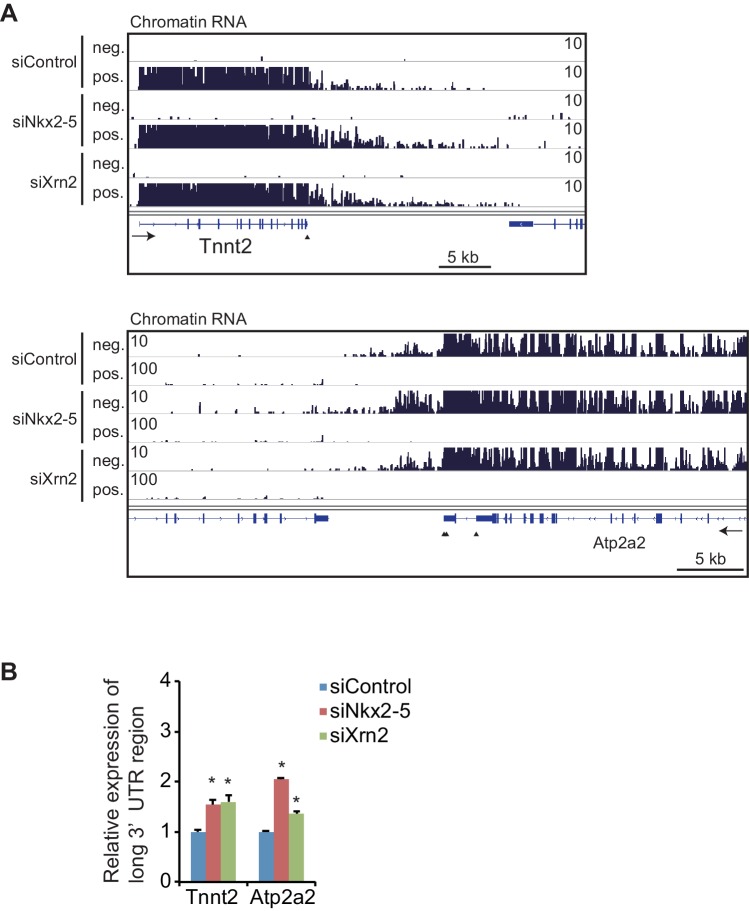
Figure 4—figure supplement 1. Knockdowns of Nkx2-5 or Xrn2 affect the expression of the long 3’UTR regions in chromatin-fractioned RNA.
Figure 4—figure supplement 2. Knockdown of Nkx2-5 affects Xrn2-binding to Myl7.
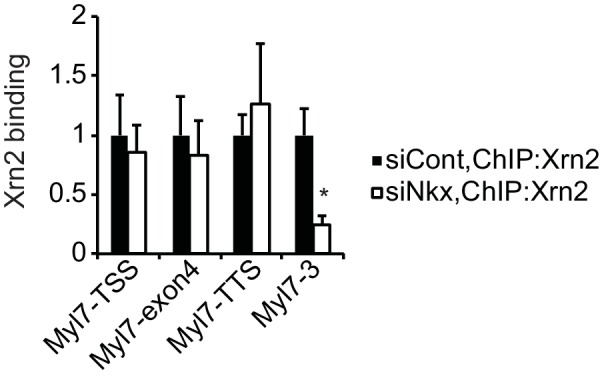
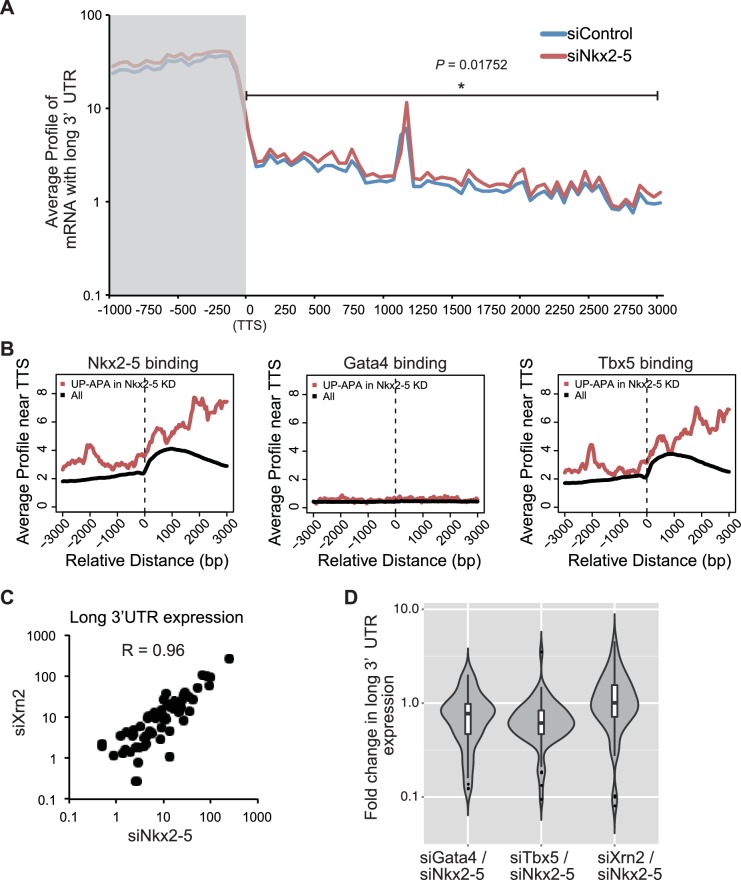
Figure 4—figure supplement 3. Nkx2-5 functions together with Xrn2 to regulate APA.
