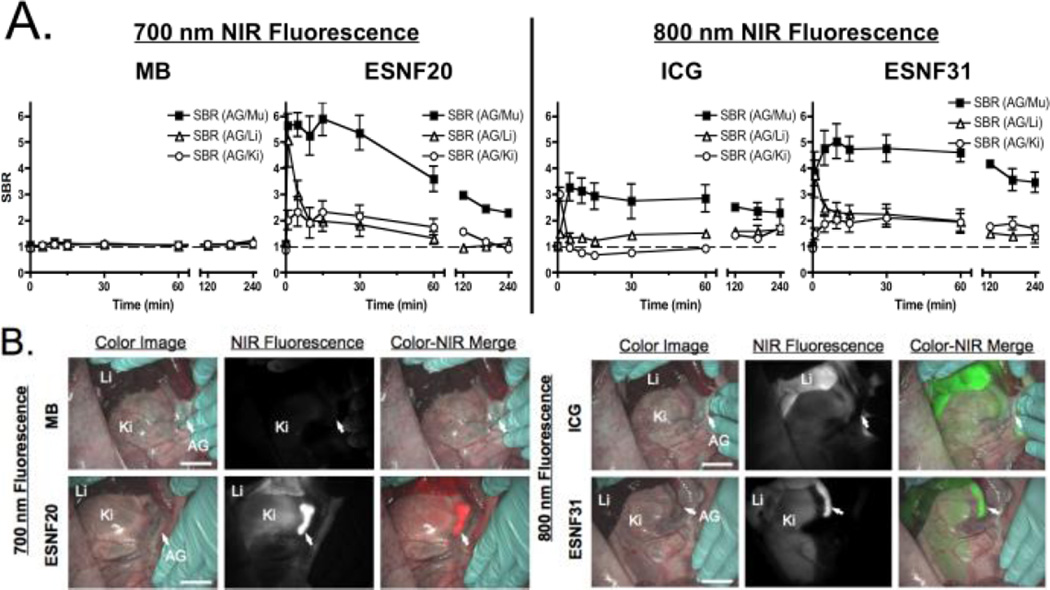
Fig. 3.
Kinetics and intraoperative imaging with 2 µmol intravenous injection of each NIR fluorophore in pigs (n = 3): A) Kinetics of AG signal relative to surrounding tissues and organs. SBR of AG compared to surrounding major tissue/organs was measured at indicated time points up to 4 h. B) Intraoperative NIR imaging of AG and surrounding organs 1 h post-injection. Red pseudo-color was used for 700 nm NIR and lime green for 800 nm NIR in the merged image. AG, adrenal gland; Ki, kidney; Li, liver. Scale bar = 3 cm.

