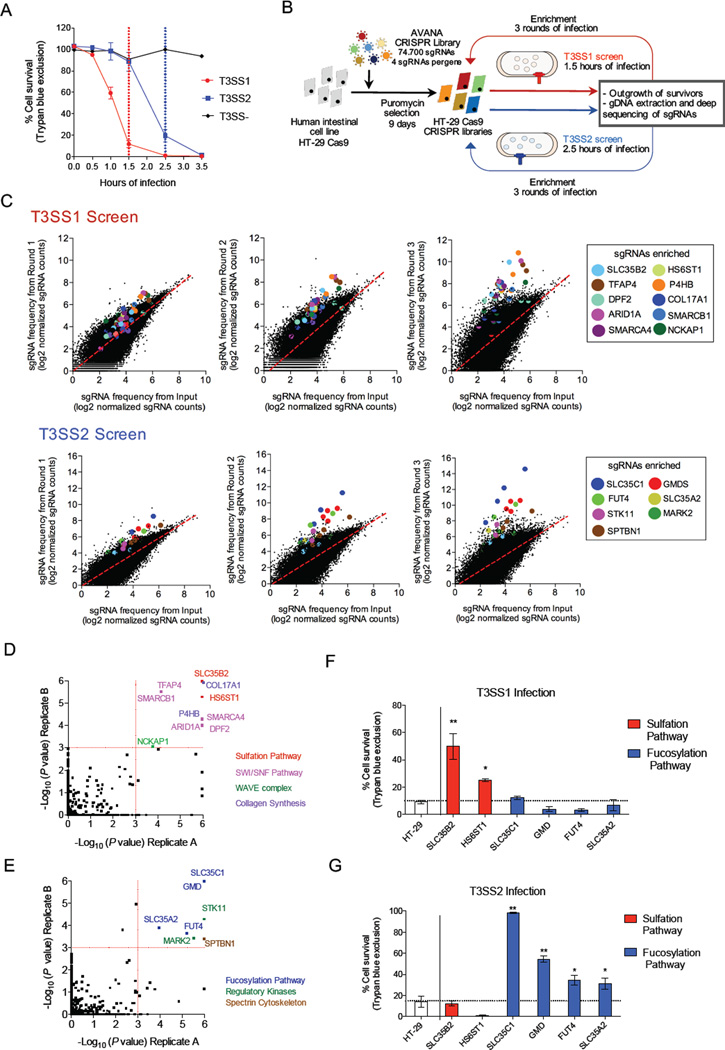
Figure 1. CRISPR/Cas9 screen reveals coherent and distinct pathways involved in resistance to T3SS killing.
(A) Kinetics of T3SS-dependent HT-29 cell death. The duration of infection for the T3SS1 (red) and T3SS2 (blue) screens is marked with dotted lines. (B) Workflow and screening strategy for the CRISPR/Cas9 screens. (C) Scatter plots showing enrichment of specific sgRNAs in the T3SS1 and T3SS2 screens after each round of infection. sgRNAs targeting the same gene are highlighted with the same color. The values correspond to log2 of normalized reads (see Table S2 for data). (D, E) Statistical significance of the gene candidates from the T3SS1 (D) and T3SS2 (E) screens in both biological replicates analyzed by STARS. Candidates for follow up had a P < 0.001 in both biological replicates. The colors of spheres indicate the associated biological process. See also Table S3. (F, G) Survival of HT-29 cells and mutant cells following infection with T3SS1+ or T3SS2+ bacteria for 1.5 or 2.5 hr, respectively. See also Figure S3B-C. Data are mean with SEM (n=3). P values (** < 0.001, * < 0.05) are based on one-way ANOVA with Dunnet post test correction.

